With apologies to the Great Bard, there appears to be something rotten in Norway.
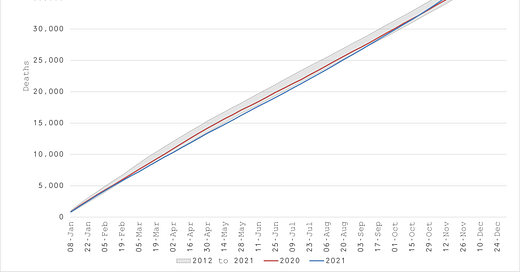
All-cause mortality for all ages looks normal enough (Figure 1). As most people know, Norway suffered very little from COVID in 2020 but the Norwegians are dying more precipitously in 2021 since early Sept.
But when you look at age-stratified deaths, things are not all they seem.
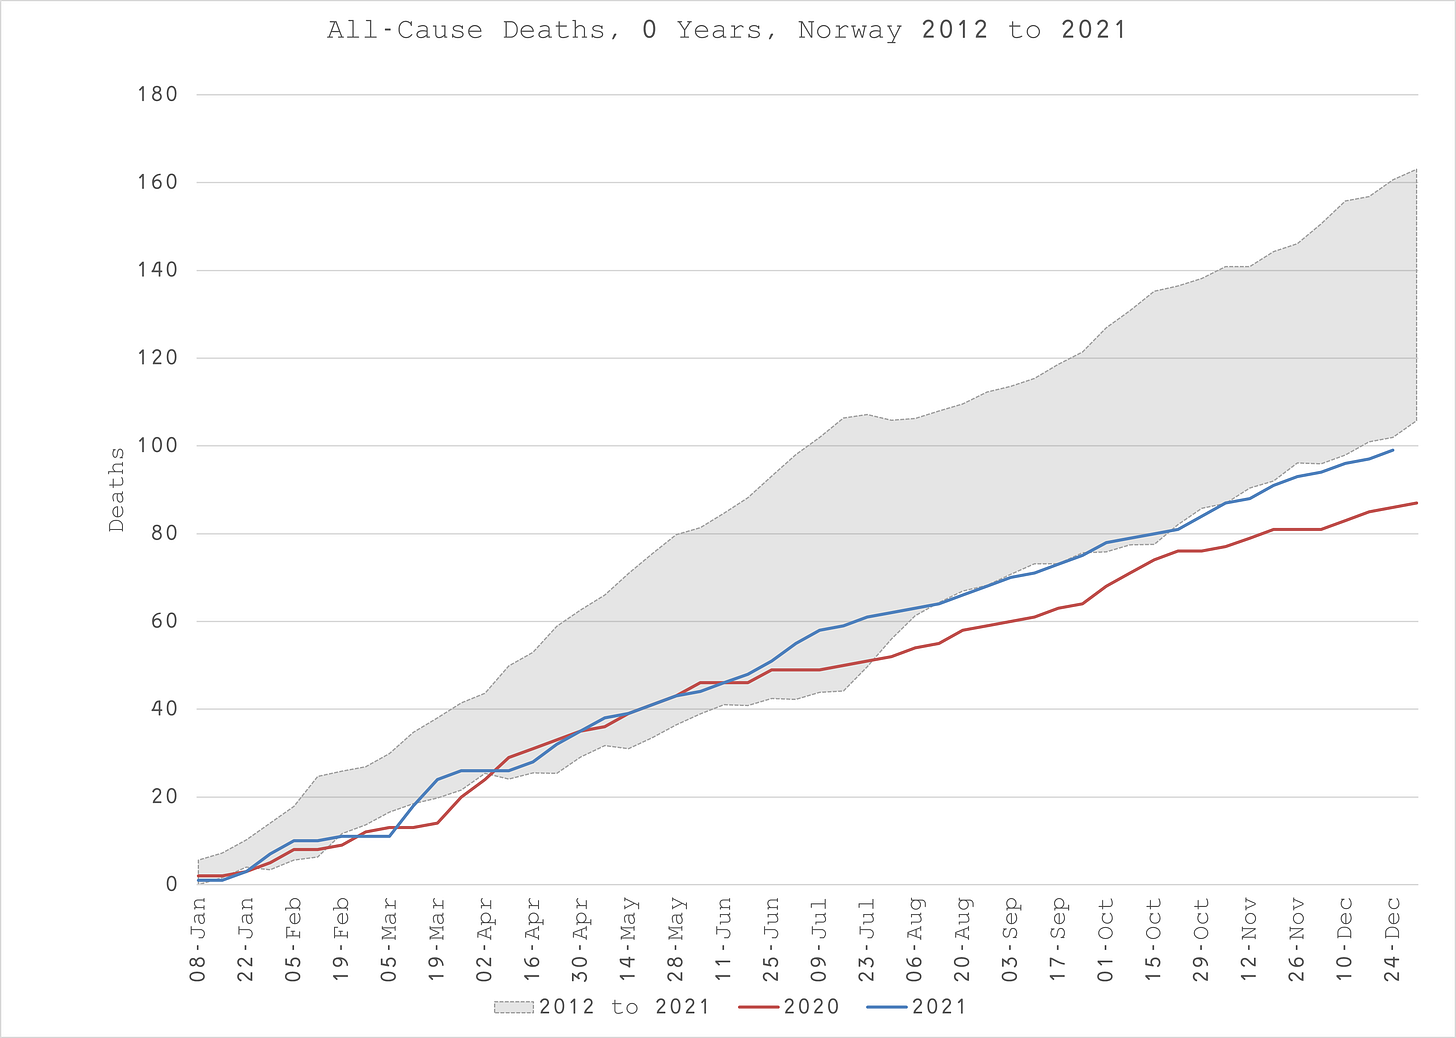
For babies, although both 2020 and 2021 are at the low end of expectations set over the 8 years prior, there seems to be an unusual hump between March and June in 2020 (Figure 2). I don’t know enough about the measures taken in Norway to speculate about a reason for this.
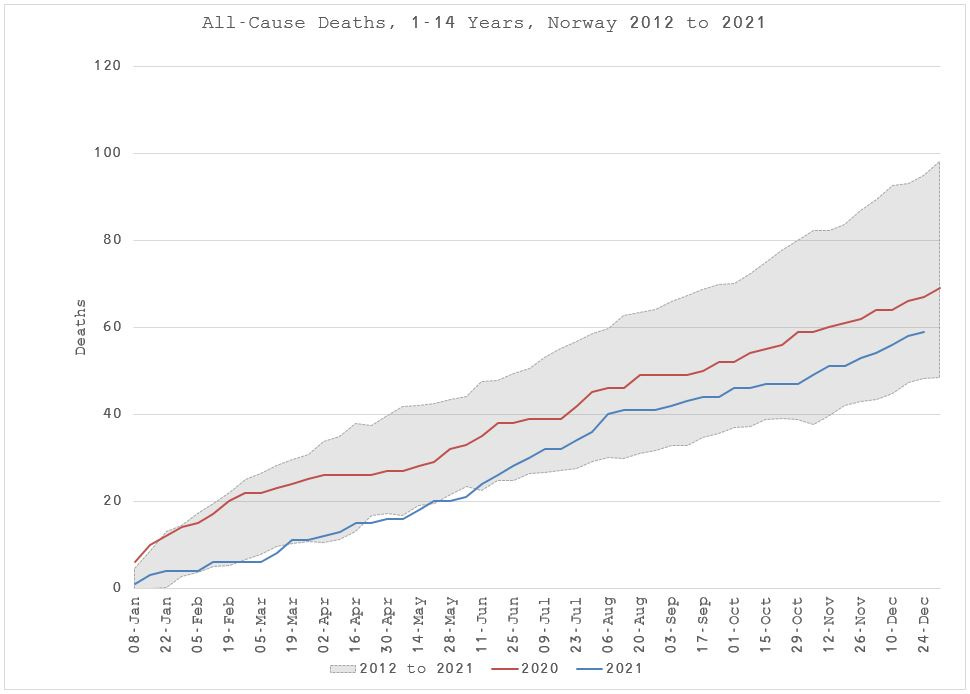
1 to 14 year olds (Figure 3) seem to have started 2020 at the high end of expectations but ended in line. 2021 started at the low end but rose sharply on 11-Jun.
15 to 19 year olds (Figure 4) appear to have been affected during the spring of 2020 when COVID was epidemic across the rest of Europe with quite a significant excess of death, considering COVID is not known to adversely affect that age group. 2021 witnesses an obvious hump in mortality between mid-May and end of Sep.
There is a conspicuous lack of death in the 20 to 24 year olds by the end of each calendar year (Figure 5). However, there appears to be a manifestation of death between mid-March and early August in 2021.
There doesn’t seem to be anything too remarkable for the 25 to 29 year olds (Figure 6). A bad year in 2020 followed by a very good year in 2021.
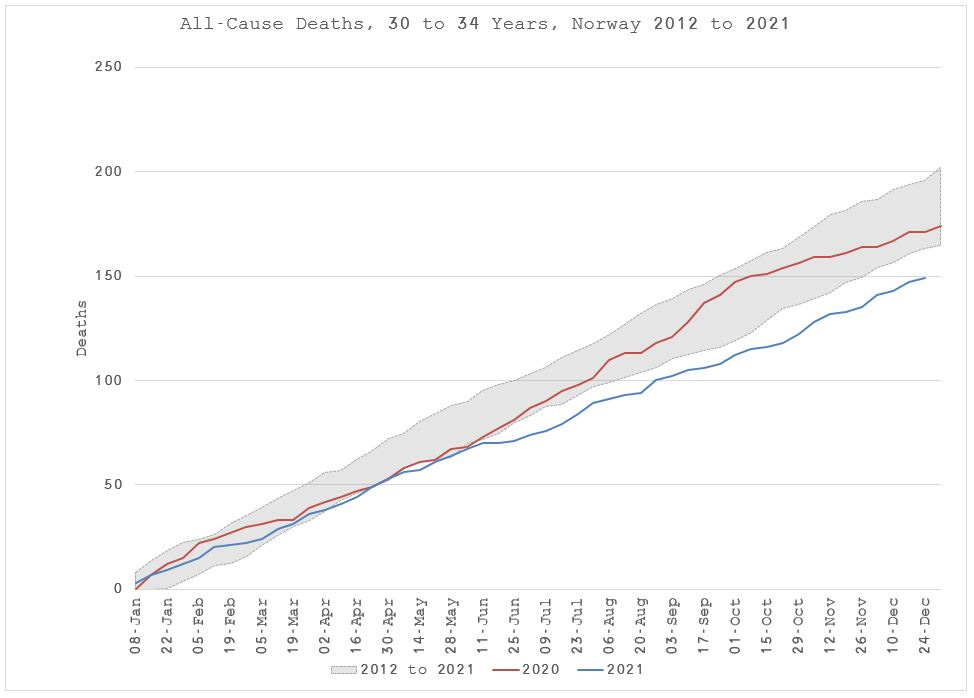
For the 30 to 34 year olds (Figure 7), there is an unusual pattern of excess deaths during the summer and autumn of 2020, followed by a very benign year in 2021 like the lower age group (Figure 7).
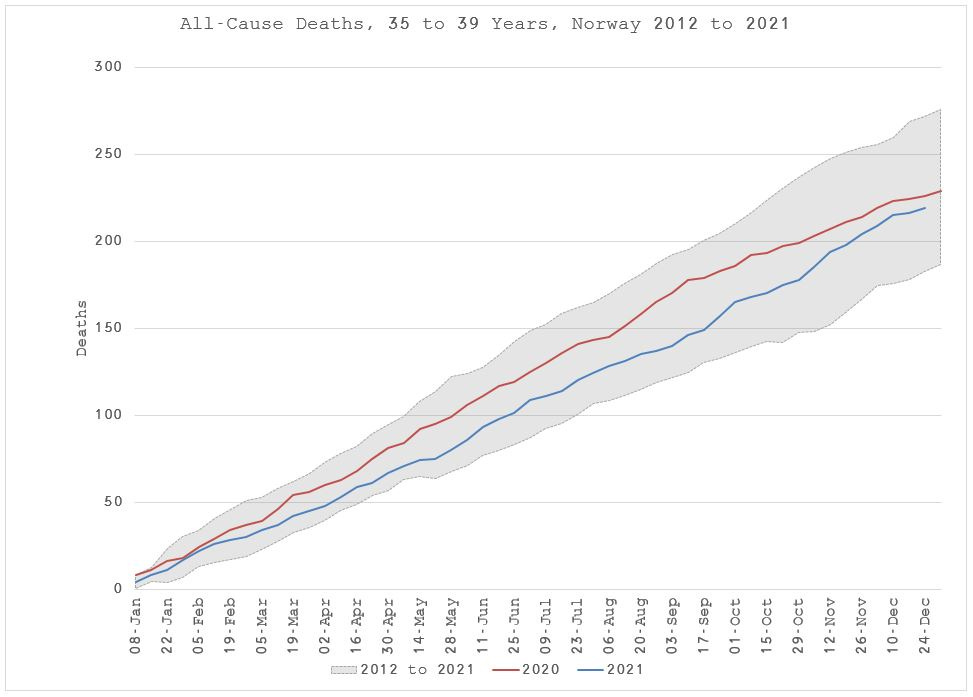
For the 35 to 39 year olds (Figure 8), after quite a regular 2020, there appears to be an unusual increase in 2021 since mid-Sept.
For the 40 to 44 year olds (Figure 9), there doesn’t seem to be much to remark upon.
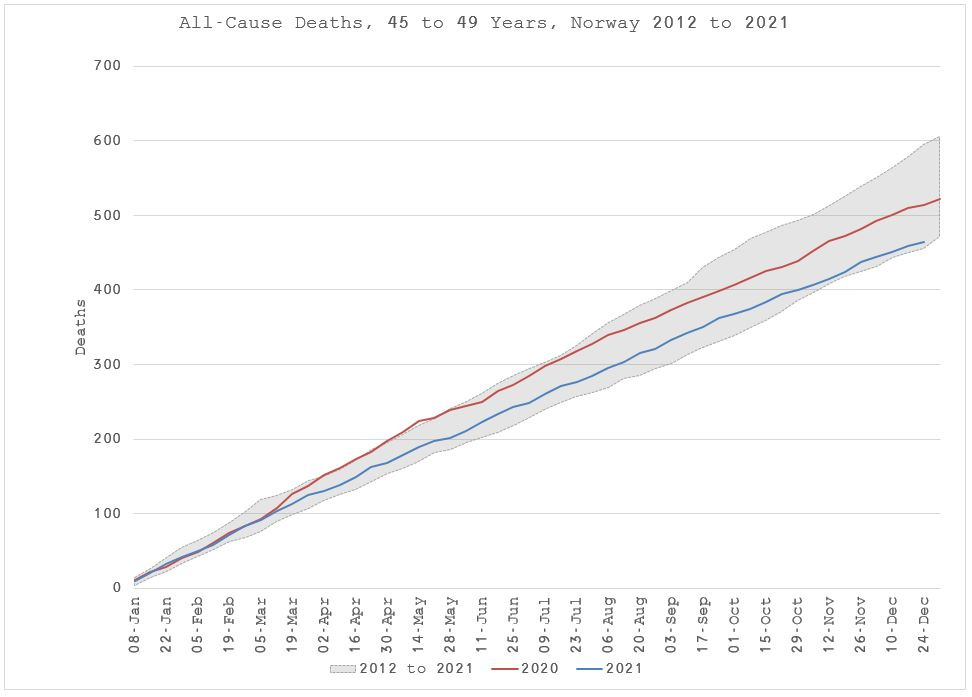
For the 45 to 49 year olds (Figure 10), we perhaps see the first real evidence of COVID mortality in March 2020, followed by a rather benign 2021.
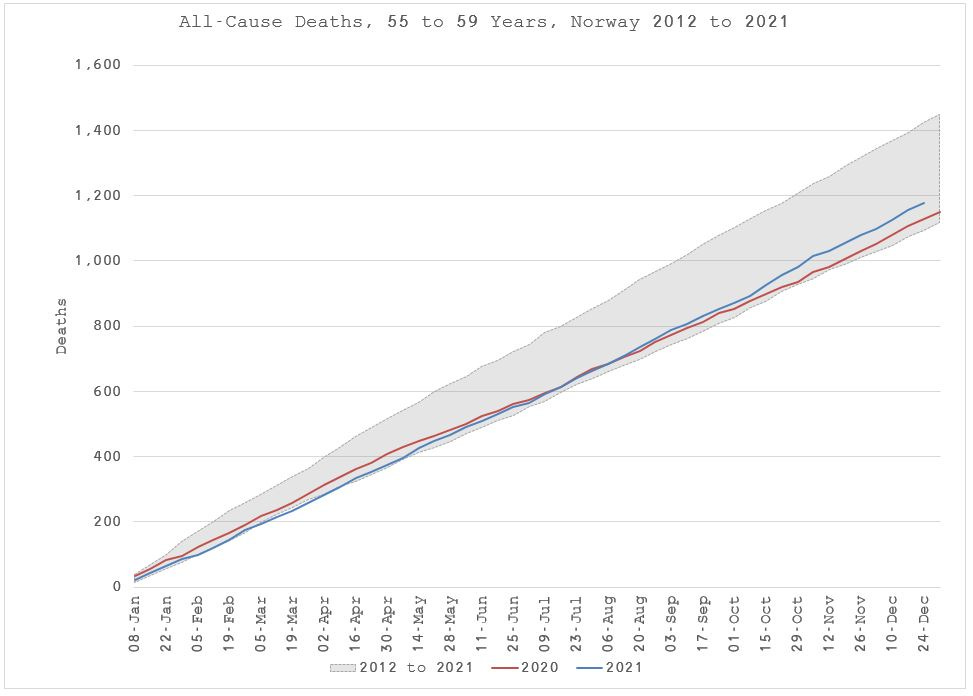
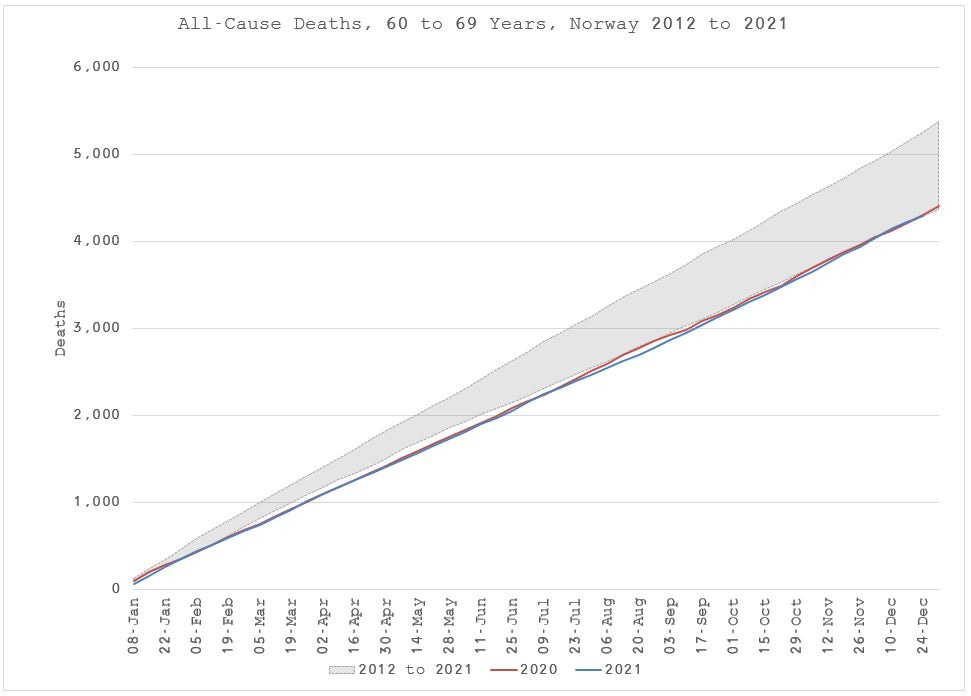
The 50 to 69 year olds seem to have conquered death by and large in 2020 and 2021 relative to previous years (Figures 11, 12 & 13).
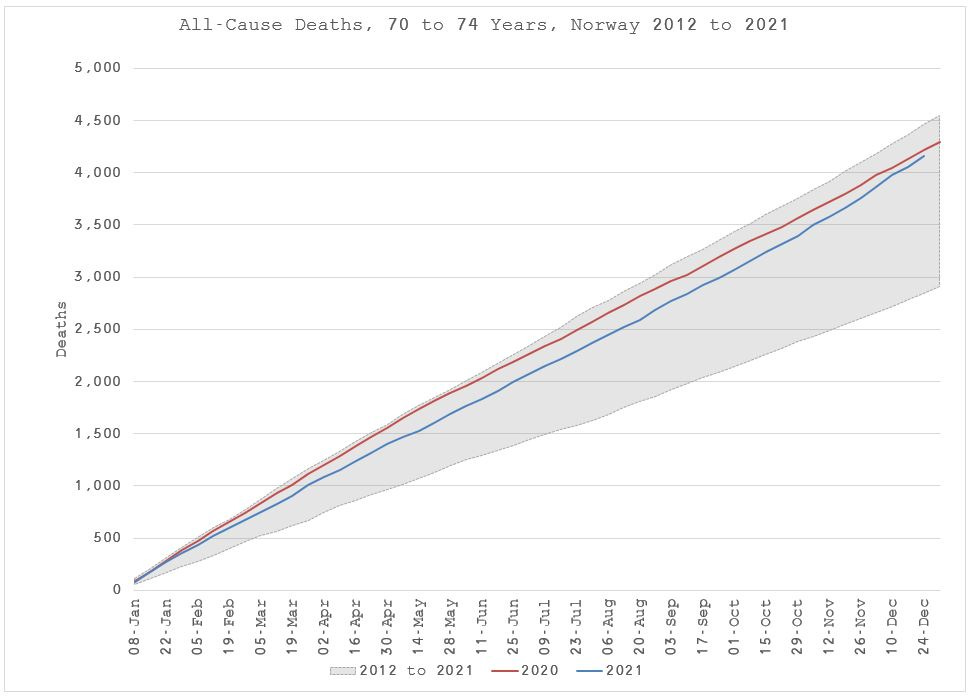
The 70 to 74 year olds have had a couple of bad years but within historical ranges and in 2021 really only since August (Figure 14).
Turning our attention to the 75 to 79 year olds, things become somewhat peculiar. After a bad 2020 due to COVID in spring, 2021 doesn’t start any better but gets much, much worse since the end of June (Figure 15).
What’s weirder still is that each individual age group has a different inflection date (Figure 16).
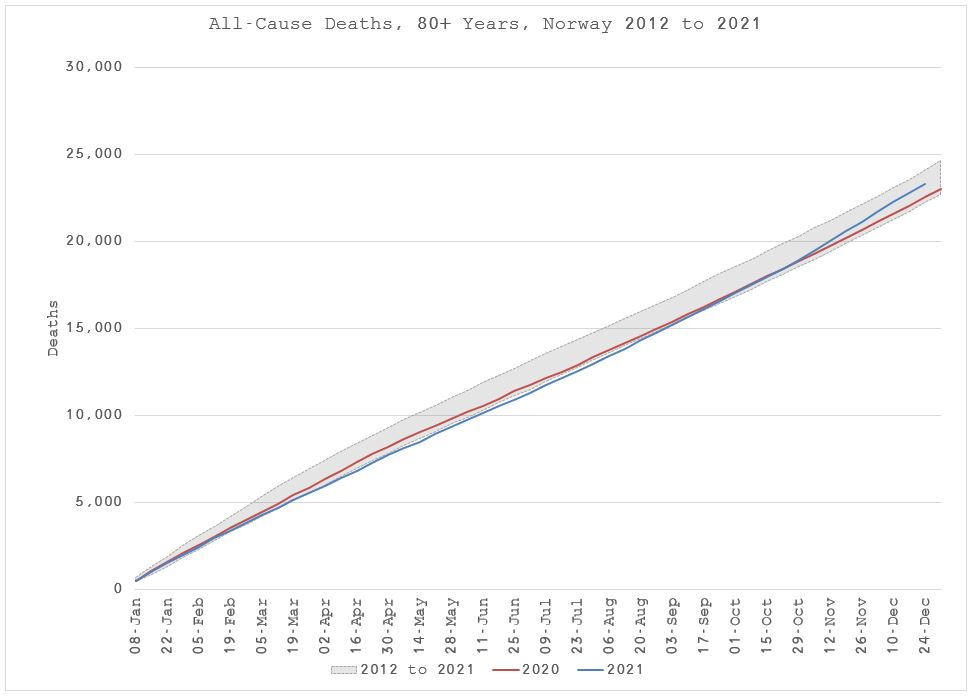
Finally, for the over 80s, they appear to have escaped pretty much unscathed during the entire pandemic until Sep 2021 when deaths finally rise towards the upper range of expectations (Figure 17).
I’m going to need some help from my Norwegian readers to make sense of this and provide other context.
All data from https://www.ssb.no/en/statbank.









Images 4 &6 ...just 20 extra suicides could account for the higher red. Seemingly not the case.
https://sciencenorway.no/covid19-mental-health-suicide/fewer-suicides-during-the-first-months-of-covid-19-in-norway/1772219
In entirely unrelated matters, 30 extra drug overdoses..
https://sciencenorway.no/cancer-death-drugs/causes-of-death-in-norway-highest-number-of-overdose-deaths-in-norway-in-20-years/1873354
Thank u for the research 👍