
Debunking Weather Event Alarmism by Paul Burgess - Climate Realism
Part 1 - Wind and Heatwaves

Introduction
I am serialising this excellent video by Paul Burgess from a couple of years ago, examining the evidence between extreme weather events and climate change.
Paul started his professional career as a young engineer working in the UK, Africa and Saudi Arabia. In 1970 he became Water Resources Engineer for River Authorities in Cornwall and Gwynedd before becoming responsible for planning water resources for the whole of Wales.

Paul developed his first climate models as far back as 1971; a workload that involved every aspect of the water cycle from weather stations to flood warnings and monitoring pollution incidents. Unable to tolerate the attitude of the nationalised water industry towards the public, he left to found his own businesses which concentrated on innovation using computer controlled systems to produce innovative products. His company won the Most Innovative Product In Wales Award and exported to some 33 countries throughout the world.
Since early childhood Paul has always been a keen environmentalist. Latterly, alarmed by the abuse of science and the censorship within the climate alarmist movement, he has made hundreds of videos and numerous media appearances on both Television and radio countering Net Zero policies and the corruption of science.
Part 1 - Wind and Heatwaves
Introduction
Common claims circulate that all extreme weather is getting worse and that human activity is to blame. However, a closer examination of the empirical evidence reveals that there is no scientific basis to link any individual weather event to human-caused climate change. This report examines hurricane and tornado data to assess whether extreme wind events are indeed increasing in frequency or intensity.
Hurricanes: The Evidence from Multiple Perspectives
The BBC Scare Documentary Prediction
A BBC program titled “The Scare” presented a theory about hurricanes and climate change. The documentary suggested that more clouds would reflect sunlight back into space and cool the planet. This represents one of the many climate predictions that have been made over the years regarding how atmospheric changes might affect weather patterns.
Global Accumulated Cyclone Energy Analysis
2020 Compared to Historical Average
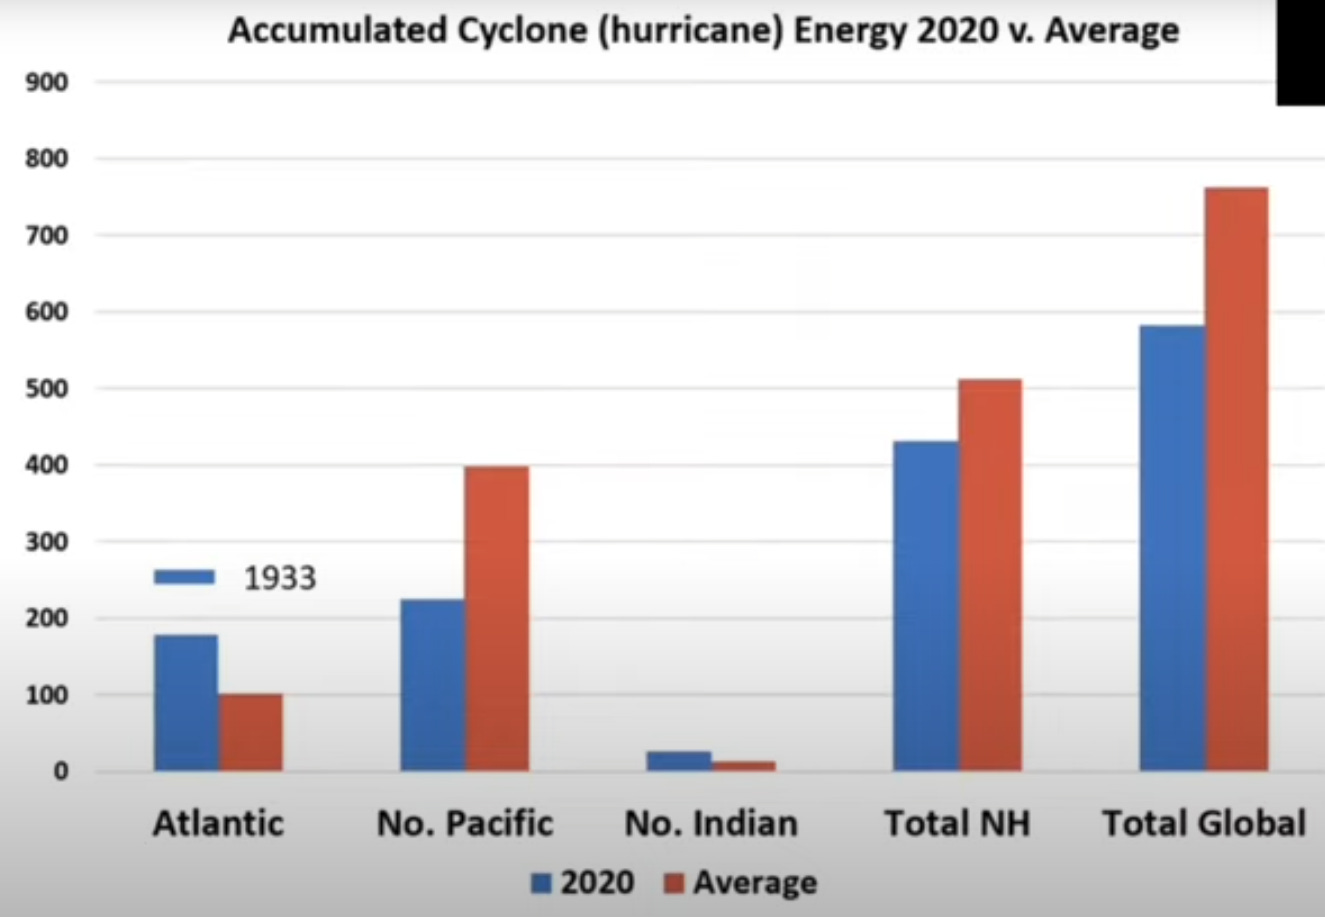
An analysis of Accumulated Cyclone Energy (ACE) for 2020 compared to long-term averages reveals important trends across different ocean basins:
Atlantic Basin:
1933: approximately 250 units
2020: approximately 175 units
Average: approximately 100 units
North Pacific Basin:
2020: approximately 220 units
Average: approximately 400 units
North Indian Ocean:
2020: approximately 20 units
Average: approximately 10 units
Total Northern Hemisphere:
2020: approximately 420 units
Average: approximately 500 units
Total Global:
2020: approximately 580 units
Average: approximately 775 units
Key Finding: The data shows that in the Atlantic Basin, 1933 experienced 40% more Accumulated Cyclone Energy (ACE) than 2020. Notably, 2020’s total global ACE was below the long-term average, indicating that worldwide hurricane activity was not at elevated levels.
Long-Term Trend (1980-2020)
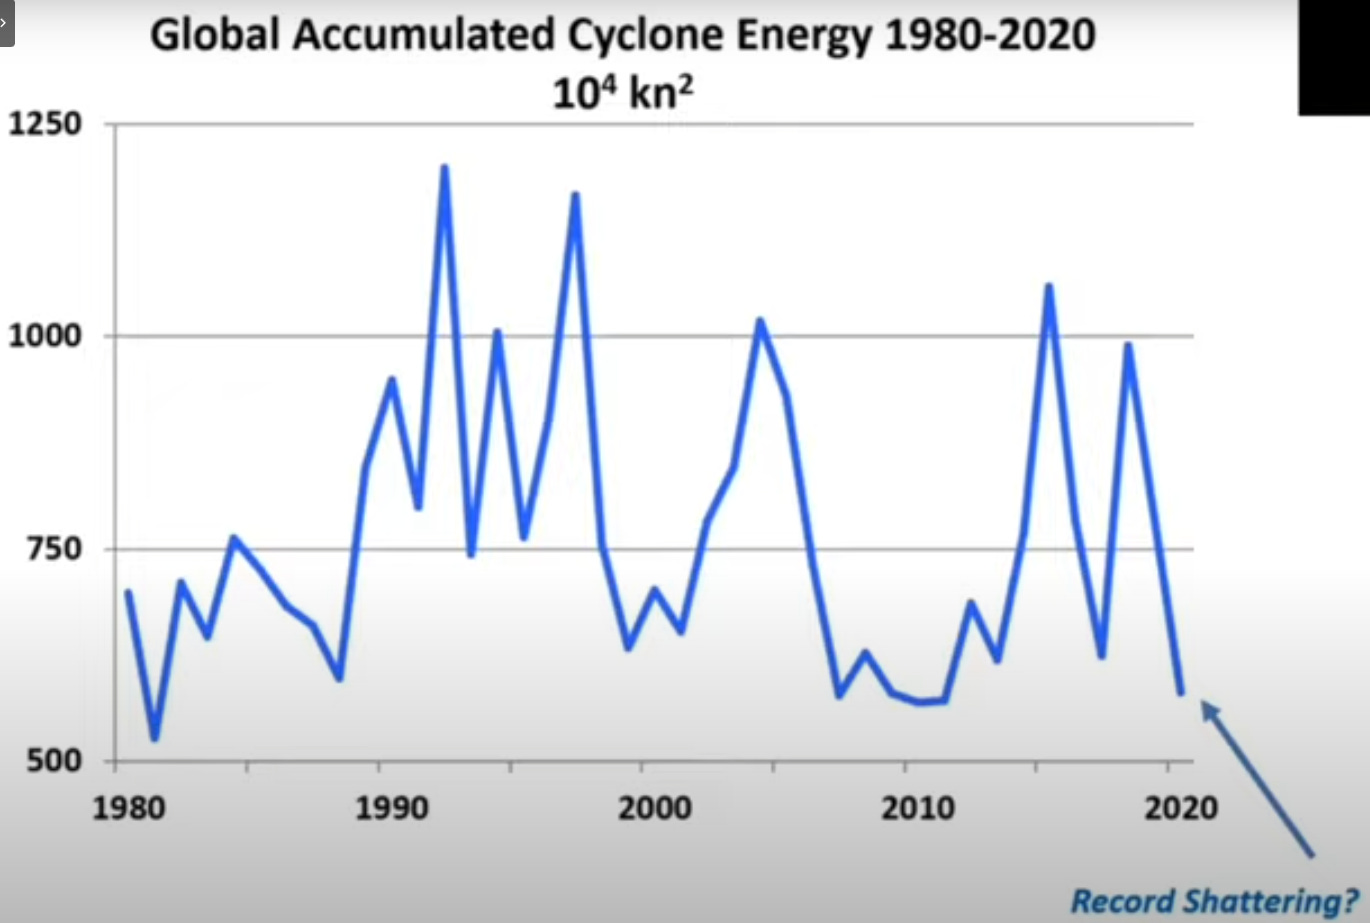
Global Accumulated Cyclone Energy data from 1980 to 2020 (measured in 10⁴ km²) shows significant variability:
The period from 1980 to 2020 shows high natural variability with peaks reaching approximately 1,200 units and valleys dropping to around 500-600 units
Peak years occurred around 1990, 1995, and 2015
The data shows considerable year-to-year fluctuation without a clear increasing trend
The most recent years (approaching 2020) show a notable decline, raising the question: “Record Shattering?” - a question that the data does not support The chart demonstrates that hurricane energy has not increased over this 40-year period; instead, it exhibits natural cyclical patterns with recent years showing lower values than historical peaks.
Historical Hurricane Loss Data
An examination of the largest hurricane losses by approximate dates reveals that many of the most destructive hurricanes occurred in the distant past:
Major Historical Hurricanes:
BAR STE BAR offshore - October 10-18, 1780
Texas (Galveston) - September 8, 1900
FIFI Honduras - September 14-19, 1974
Dominican Republic - September 1-6, 1930
FLORA Haiti, Cuba - September 30-October 8, 1963
Pointe-a-Pitre Bay (GUA) - September 6, 1776
Newfoundland Banks - September 1775
Puerto Rico, Carolinas - August 8-19, 1899
FL GUA PR TUR MAR - September 12-17, 1928
Cuba CI Jamaica - November 4-10, 1932
Central Atlantic - September 16-17, 1782
Martinique - August 1813
El Salvador, Honduras - June 4-5, 1934
Western Cuba - October 21-22, 1791
Barbados - August 10-11, 1831
Belize - September 9-10, 1931 This historical data includes death tolls and data sources with extensive footnoting. The critical observation is that the deadliest and most destructive hurricanes largely occurred before 1960.
National Hurricane Center Data: The Deadliest Atlantic Tropical Cyclones (1400-1996)
According to National Hurricane Center records spanning from 1400 to 1996, the deadliest Atlantic tropical cyclones cluster in specific historical periods:
Years highlighted for exceptional deadliness:
1780, 1900, 1974, 1930, 1963, 1776, 1775
The appendix titled “The Deadliest Atlantic Tropical Cyclones, 1492-1996” shows that the most lethal hurricanes occurred well before the modern era of supposed climate change intensification.
Contemporary Hurricane Frequency (1981-2021)
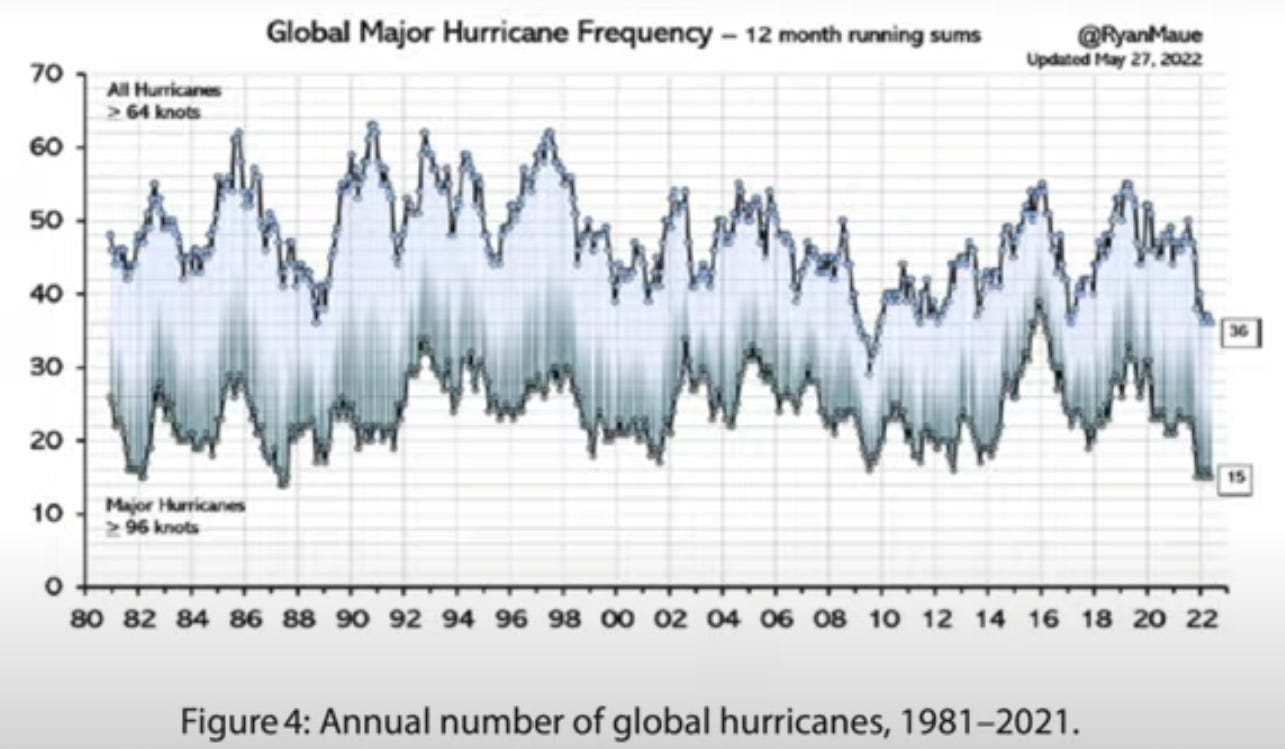
Figure 4 from Ryan N. Maue’s research shows “Annual number of global hurricanes, 1981-2021” with two categories tracked:
All Hurricanes (at least Cat 1)
Major Hurricanes (at least Cat 3, shown as Hurricane strength) The data displays a 12-month running sum and presents the following pattern:
Hurricane numbers fluctuate between approximately 30 and 70 hurricanes per year
Major hurricanes show even greater variability, ranging from approximately 10 to 35 per year
No clear upward trend is visible in either category
The data shows natural cyclical patterns rather than sustained increases
Recent years (2018-2021) show values consistent with the long-term average, not elevated extremes. This contemporary analysis confirms that hurricane frequency has remained relatively stable over the past four decades, contradicting claims of dramatic increases in storm activity.
Tornadoes and Climate Change
The Scare Documentary’s Cautious Position
“The Scare” documentary addresses tornadoes with notable caution. The presentation acknowledges: “Tornadoes and Climate Change” “Climate change will likely make extreme weather events more common. Some types of weather are easy to attribute to climate change. But with tornadoes, things are a bit more complicated.” The documentary then adds a critical qualifier: “Alarmists claims become ‘a bit more complicated’ when evidence shows the exact opposite.” This statement recognizes that the data on tornadoes does not support the narrative of increasing extreme weather due to climate change.
U.S. Major Tornado Data (1954-2020)
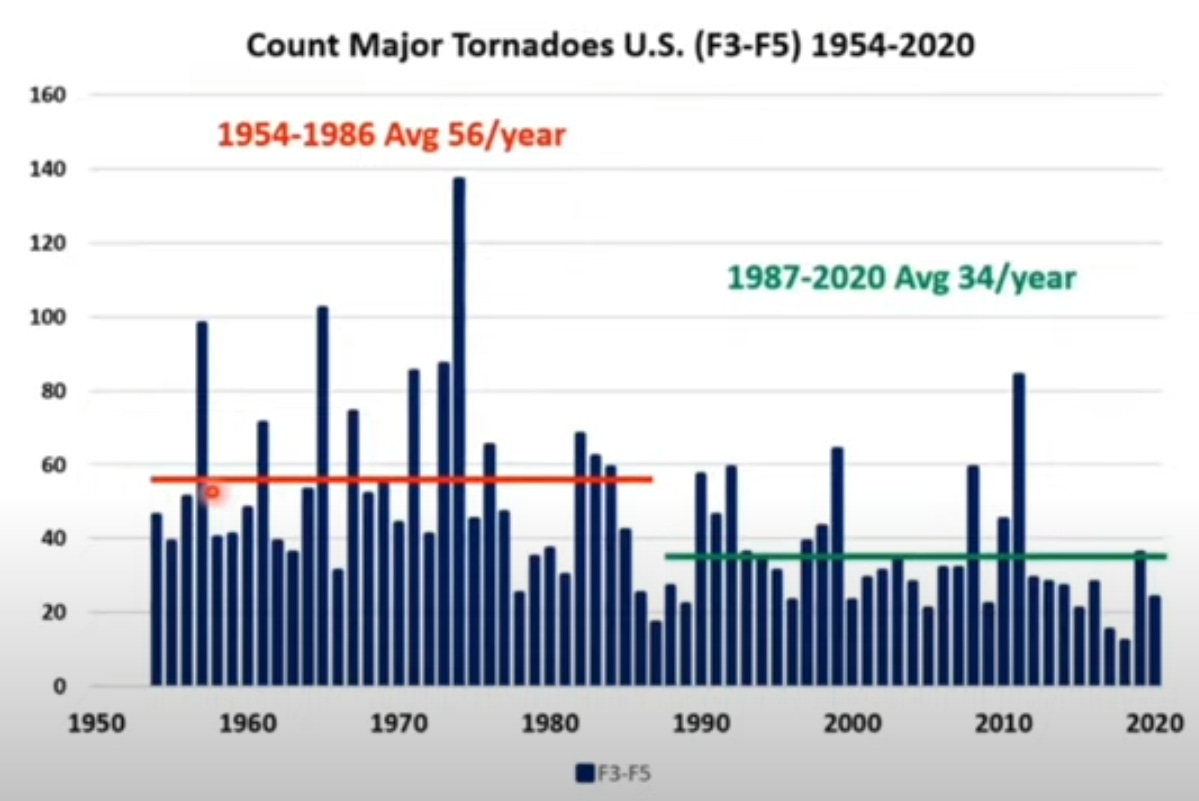
Count Major Tornadoes U.S. (F3-F5) 1954-2020 The data reveals two distinct periods with markedly different tornado frequencies:
Period 1 (1954-1986):
Average: 56 tornadoes per year
This earlier period shows consistently higher tornado counts
Peak years reached approximately 140 tornadoes Period 2 (1987-2020):
Average: 34 tornadoes per year
This recent period shows significantly lower tornado counts
Represents a decline of approximately 39% compared to the earlier period Key Findings:
The chart shows a clear declining trend in major tornado frequency
The highest tornado counts occurred in the 1970s and early 1980s
Recent decades show substantially fewer intense tornadoes
There is no evidence of increasing tornado activity; rather, the opposite is true
Detailed U.S. Tornado Count Analysis (1950-2021)
Figure 7: Annual count of tornadoes in the US, 1950-2021 This figure presents two separate analyses:
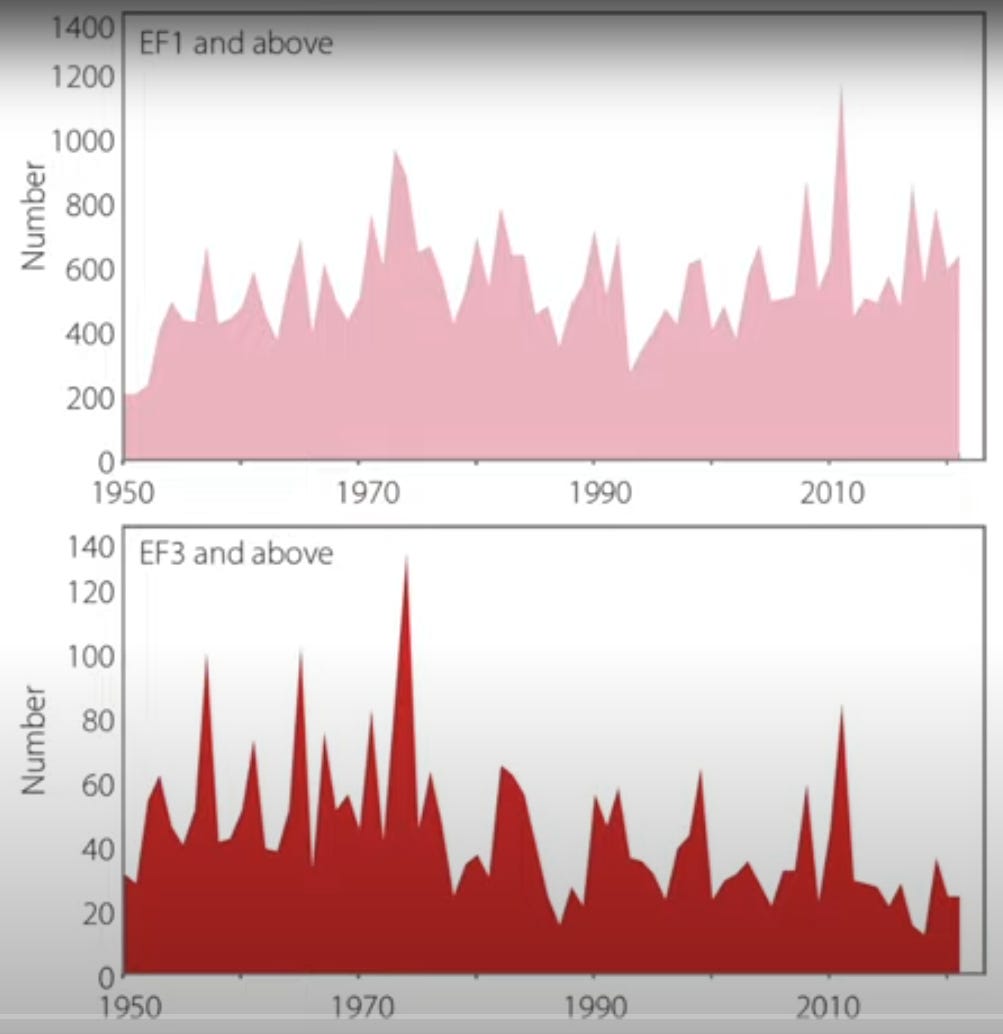
Top Panel - EF1 and above:
Shows all tornadoes rated EF1 or higher (defined as EF1 and above; bottom, major tornadoes defined as EF3 and above)
Data spans from 1950 to beyond 2010
The distribution shows considerable year-to-year variability
Counts range from approximately 200 to 1,200 tornadoes per year
No clear increasing trend is evident in the long-term data
Bottom Panel - EF3 and above:
Focuses on major tornadoes only (EF3 and higher intensity)
Shows a range from approximately 20 to 140 major tornadoes per year
Peak activity occurred in the 1960s-1970s period
More recent decades show lower counts of major tornadoes
The trend suggests a decrease rather than an increase in the most severe tornadoes Source: NOAA/NCEI The data demonstrates that both total tornado counts and counts of the most severe tornadoes do not support claims of increasing tornado activity due to climate change.
Hot Weather Analysis
Record High Temperature Analysis
Title: “Number of Daily Record High Temperatures by year for 737 USHCN Stations with at least 105 years of record (1895-2020)” Subtitle: “11,365 observations (expected value is 794 each year)” The analysis examined 737 U.S. Historical Climatology Network (USHCN) stations with lengthy temperature records to identify when record high temperatures occurred.
Key Finding Highlighted: “The occurrence of Record High Temperatures is not increasing”
Additional Critical Finding: “14 of top 15 years with most heat records occurred before 1960”
Data Pattern (1895-2020):
The chart shows significant variability across the entire period
Peak years for record high temperatures occurred in the 1930s, with the highest spike reaching approximately 2,500 daily record highs
The 1930s Dust Bowl era shows the most intense clustering of heat records
Subsequent decades (1940s-present) show substantially lower counts
Recent decades do not show elevated levels of record high temperatures
The overall pattern contradicts claims of unprecedented modern warming
Data Source: John A. Christy, The University of Alabama in Huntsville, NCEI/NCDC data (downloaded 11 Feb 2021) This analysis provides strong empirical evidence that the hottest weather in the United States occurred in the early-to-mid 20th century, not in recent decades.
Percentage of Stations Reaching 95°F (35°C) or Above
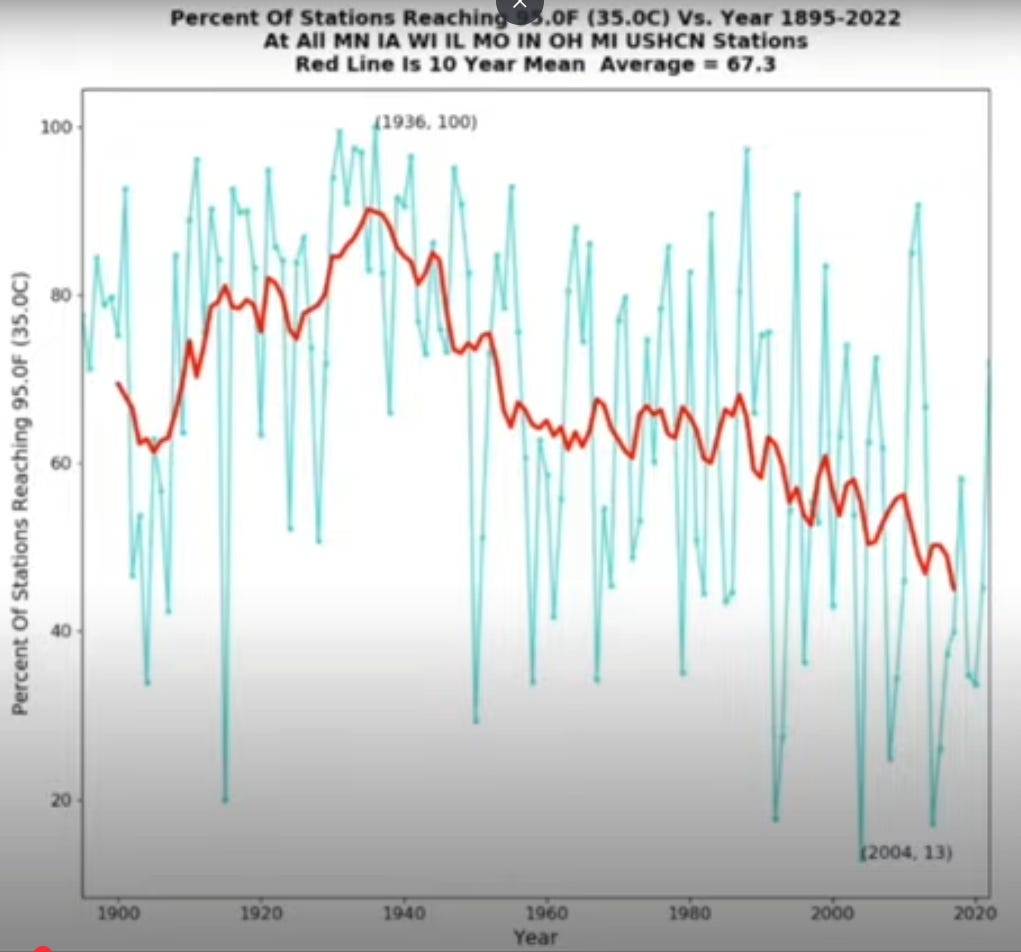
Chart Title: “Percent Of Stations Reaching 95 or (35.0C) vs. Year 1895-2022” Subtitle: “At All FEB to OCT vs. NO (0) OCT UNIQUE Stations” Time Period: 1895-2022 This analysis tracks what percentage of weather stations recorded temperatures of 95°F (35°C) or higher each year.
Peak Period (1930s-1940s):
The highest percentage occurred around 1936, reaching nearly 100%
The 1930s consistently showed 80-100% of stations recording extreme heat
This represents the most widespread heat in the record
Historical Trend:
From 1895 to the 1930s, there was an increasing trend (red trend line)
The red trend line peaks in the 1930s-1940s era
After the 1940s, there is a clear declining trend (red trend line descending)
Recent Decades (1960s-2022):
Shows substantially lower percentages than the peak period
Most recent years show between 40-60% of stations recording such temperatures
The blue/cyan bars show high year-to-year variability but generally lower values
The declining red trend line indicates fewer stations are recording extreme heat
2020s (ending around 1-1-1):
Recent years continue to show values well below the 1930s peak
No evidence of returning to early 20th century heat extremes
Critical Finding: The data demonstrates that a smaller percentage of weather stations are recording extreme heat (95°F+) now than in the past, with the 1930s representing the peak period for widespread heat. This directly contradicts claims that extreme heat events are becoming more common in recent decades.
Conclusion
The empirical data on extreme wind events and heat waves presents a consistent picture that challenges common narratives about worsening extreme weather:
Hurricanes:
Global Accumulated Cyclone Energy shows no increasing trend from 1980-2020
The year 1933 had 35% more cyclone energy than 2020
Recent years show lower hurricane activity than historical averages
The deadliest hurricanes occurred before 1960
Frequency of major hurricanes has remained stable over the past four decades
Tornadoes:
Major tornado counts (F3-F5) have declined by approximately 39% from the 1954-1986 period to the 1987-2020 period
The highest tornado activity occurred in the 1970s
No increasing trend in tornado frequency or intensity is evident in the data
14 of the top 15 years with the most heat records occurred before 1960
Heat:
Record high temperatures are not increasing in frequency
The 1930s produced far more heat records than recent decades
A smaller percentage of weather stations now record extreme heat (95°F+) compared to historical periods
The most widespread and intense heat occurred in the early-to-mid 20th century The evidence presented here demonstrates that claims of universally worsening extreme weather are not supported by the data for wind events and temperature extremes. While some forms of extreme weather may be changing, the specific categories of hurricanes, tornadoes, and extreme heat show either stable trends or declining intensity when examined over long time periods. This emphasizes the importance of examining actual empirical data rather than relying on predictions or selective short-term observations when assessing climate-related trends.
Climate change is a scam and possibly a cover up or mis-direction of focus for the masses. No quibble. But weather MODIFICATION is a different puppy altogether and is definitely going on. Not to our benefit. No regulations. No understanding of what interfereing with global weather patterns over time can do. Layered over what many scientists (also not being discussed in MSM) are noting are planet pole shifts; sun cycles; and galactic electromagnetic cycles. All of which may also be converging and having an impact on the planet, weather patterns, and our electromagnetic shield which IS weakening. Plus anything space probes or satellites might be up to.
Weather modification is a definite “thing.” The US doesn’t talk about it but you can find discussions on both the NOAA and NASA websites. The UK is deliberately executing a sun dimming program and Iran has started a cloud seeding program to help with its drought problems (which may have been caused by American weather warfare.)
My fossil fuel-based truck and tractor and cows and chickens and sustainable farming aren’t a problem. Pollution is. And deliberate weather mucking about - that is a definite problem. Not much we can do about natural cycles. At least I hope all the weather mod experiments aren’t being done to intensify those or interrupt them. But humans ARE making a mess of things. Just not the way Greta has been screaming about.
I tend to believe that the weather modification that they’ve been doing for the last few decades is what is actually leading if it’s occurring to any unstable weather patterns that we’re having, and the fact that they are cooling the planet is going to jeopardize our ability to feed ourselves because plants and animals are being affected.