Do the COVID-19 injectables (aka "vaccines") reduce COVID-19 hospitalisations? ***Corrected
Analysis of US counties 24-Feb to 19-May 2022 shows a statistically significant POSITIVE correlation between vaccination and hospitalisation.
I posted this this morning:
Some how, I managed to delete 75% of the data. So, here it is again based on the complete set of counties that reported. The results are different. I have highlighted the differences in bold italics.
Method
Regression of COVID-19 hospitalisation rates between 24-Feb and 19-May 2022 and rates of full and booster vaccination rates on 19-May-22 for the 3,095 US counties that reported the data.
Results
There is a positive relationship between hospitalisation rates and the rate of full vaccination. In other words, the higher the rate of full vaccination, the higher the rate of COVID hospitalisations, assuming ceteris paribus.
There is a positive relationship between hospitalisation rates and the rate of booster vaccination. In other words, the higher the rate of booster vaccination, the higher the rate of COVID hospitalisations, assuming ceteris paribus.
Both variables are statistically significant but the model has very low explanatory power. In other words, there are lots more factors in play but the small impact of COVID vaccination is statistically significant, i.e. not random or due to chance.
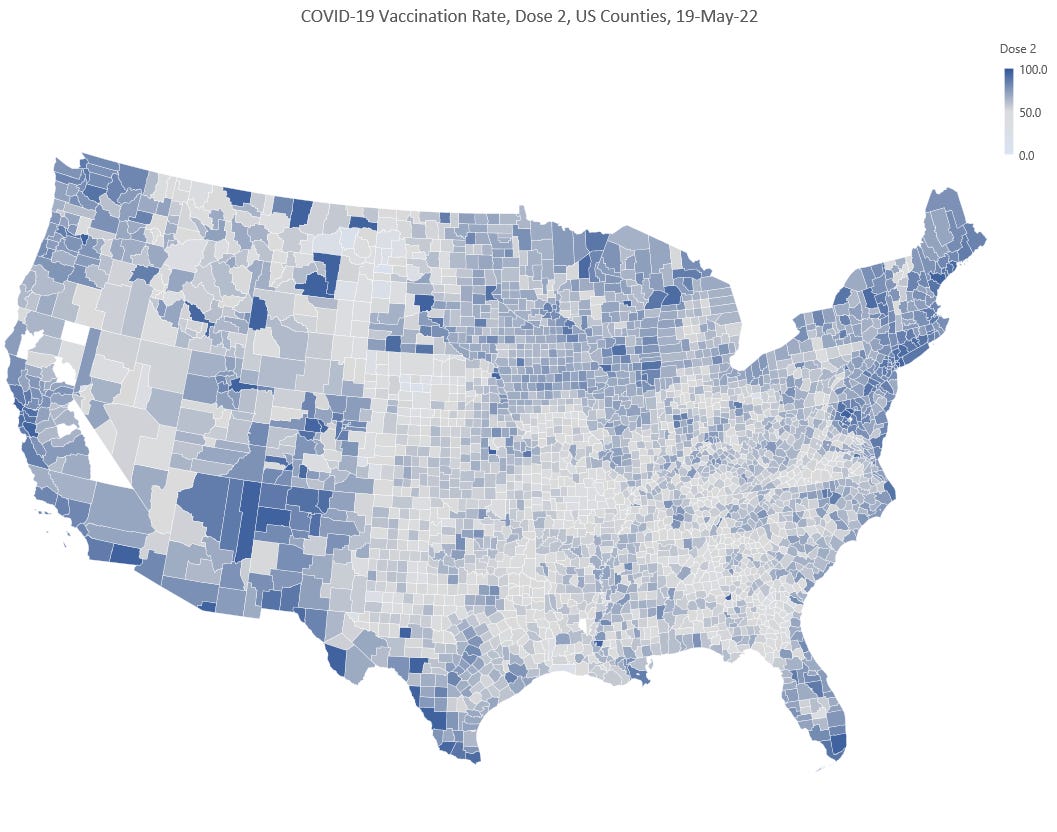
Interestingly, the South (Bible Belt) had the least fully vaccinated counties. They are also Republican.
Given how few boosters have been taken up relative to prior doses, it seems the rest of the Republican states apart from Nebraska have wised up now as well.
It’s just the Democrats in the Midwest, North East and West Coast that haven’t cottoned on yet.
Not that the whole thing is political or anything!
You can see the higher hospitalisations on the map, especially in the North East.


Thanks for the updates.
Years ago, a (statistical) colleague advised me that, if it is necessary to conduct a test to tell whether or not a relationship is significant, then it isn't significant. These scatter diagrams are a good example of that: when R-squared is only around 1-2%, it is clear that the vaccinations (including boosters) are ineffective.
Please do an analysis of rural v. urban counties.