The dead are shouting. The govt and public health are not listening.
Deaths of under 75s in England. What do they tell us about COVID and COVID vaccines?
When looking at trends in deaths, it is prudent to adjust for trends. The usual way is to use mortality rates instead of absolute numbers.
This isn’t perfect because it relies on estimating the size of the population (something that our dear official national statistics organisation is as bad at as reliably analysing COVID data) and also does not account for other factors.
For example, the mortality rate itself may also be trending due to changes in health demographics and/or quality of care.
In this short study of deaths in under 75s in England since 2001, I’m going to use some classic time series techniques to infer a reliable expectation of deaths for 2020 to 2022, against which we can compare the actual number of people that died each month during that time period.
The technique is simple, using polynomial and linear trends on different sections of the data.
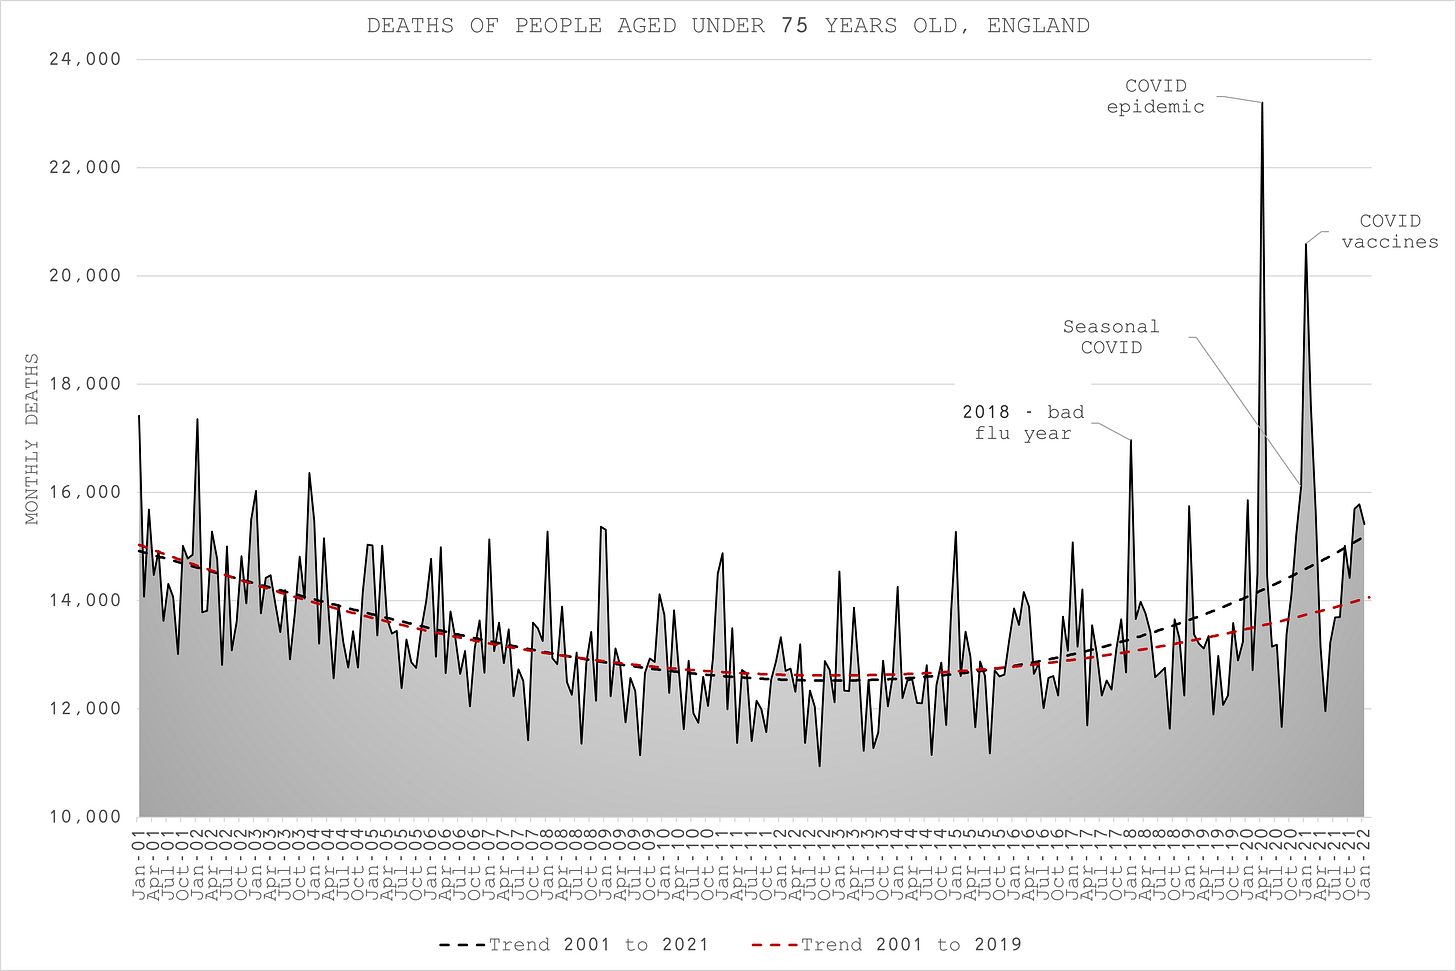
Figure 1 represents the monthly deaths of under 75 year olds in England for the last 20 years. It is clear that deaths were consistently decreasing between 2001 and 2010 before plateauing for a few years and then rising since 2014.
I have plotted simple 3-order polynomials through the data to illustrate this, one using data only up to 2019 and another using all the data up to the end of 2021. This immediately shows the impact of COVID and related interventions that will be discussed in more detail below.
For context, I have also highlighted some relevant monthly peaks - the bad flu year of 2018, the very bad month of the COVID epidemic (April 2020), the not so unusual seasonal return of COVID in autumn 2020 and the unexpected late season surge in Jan 2021, that coincided with the mass COVID vaccination program.
Monthly data is useful for identifying specific periods of activity but does not tell us the whole picture about absolute mortality impact. If we look at annual deaths between mortality seasons, we can see whether those monthly deaths were simply deaths pulled forward by a few weeks or even months, or were more significant in terms of life years, a more useful metric.
In order to estimate the expected deaths, I used a linear forecast of each month between 2014 and 2019 so that each year from 2020 had a higher and higher forecast since the trend was positive. I then smoothed this forecast with a 2-order polynomial.
This is as objective as it gets with the only drawback that it assumes that whatever factors were in play between 2014 and 2019 continue through to 2022. In other words, the assumption is that only COVID and mass COVID vaccinations are the things that changed.
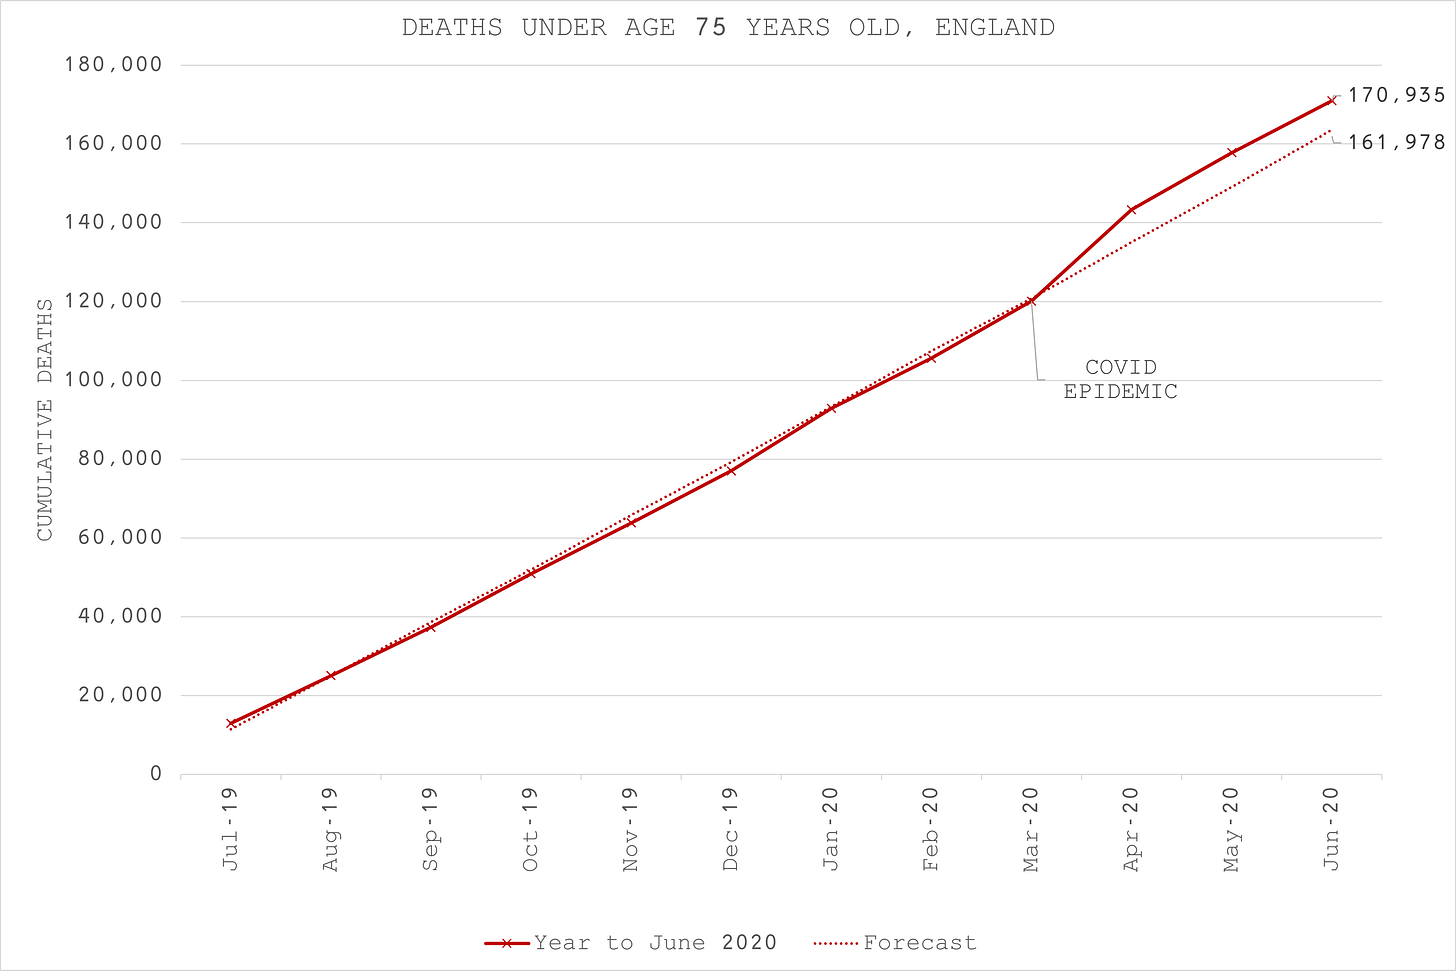
Figure 2 represents the cumulative deaths of under 75 year olds in England for the year between Jul 2019 and Jun 2020. This period encapsulates the entire period of the COVID epidemic which we have demonstrated many times before was over due to seasonality by mid-June.
From Figure 2, we can observe that the impact of “epidemic” COVID was felt for just 1 month, after which deaths returned to their expected trajectory.
For the final month, deaths rose less than usual, indicating that indeed some of those April deaths were simply pulled forward a couple of months.
By the end of this mortality year and the the complete absence of COVID mortality, deaths in this age group are 6% higher. They were bang on expectation immediately before COVID so we can safely conclude that this 6% increase is due to COVID and the intervention policies that went with it.
Figure 3 represents the cumulative deaths of under 75 year olds in England for the year between Jul 2020 and Jun 2021. This period includes the season return of COVID in autumn and the bulk of the COVID vaccinations.
When I say with confidence that COVID was seasonal and distinguish between COVID deaths and vaccine deaths in 2021, it’s because it is evident by looking at the data.
Deaths are exactly on expectation until Nov 2020. They rise a little above expectations for the next month. From previous studies, we know that most of the COVID deaths at this time were in areas that were least hit during the spring epidemic. We also know that the bulk of COVID mortality appears to occur in about a 1-month time period judging by the spring data.
Thereafter, we have a significant increase in deaths above expectation starting at the end of Dec 2020 when the mass vaccination program started in real earnest. This increase persists for three months, not the one month we have come to expect of a natural COVID outbreak.
The vaccination program spanned that entire 3 month program. Therefore, according to the principle of Occam’s razor, our main hypothesis for cause must be the vaccine and we should expect the public health authorities to be directing significant resources to investigate this.
Inevitably, we should also expect for the mass vaccination program to be halted as soon as this signal becomes apparent.
By the end of this mortality year, deaths are 7% higher than expected, 1% more than the year when COVID first struck. Pause. Does it look like the intervention is working to reduce mortality?
We only have data for 2022 up to January so Figure 4 represents cumulative deaths for the 7 months since Jul 2021 for under 75 year olds in England.
Unlike the post-COVID summer, we can clearly see that deaths in this new mortality year start higher than expected (including the annual inflation) and increase further month on every month. There seems to be a slight inflection further still after Oct 2021 when the vaccine booster campaign was started.
Year to date, deaths are 8% higher than expected.
In summary, the data suggests that:
9,000 people under the age of 75 died as a result of COVID and any short-term impact of intervention policies in 2020;
around 12,000 most likely died mainly as a result of the vaccine but perhaps some of COVID too; and
so far in 2022, around 8,000 people have died as a result of the long-term consequences of the COVID intervention policies, including the continued vaccination program.
All in all, it is not unreasonable to suggest that already roughly twice as many people have died as a result of interventions, including mass vaccination, as have died from COVID.
It is difficult to imagine any reasonable explanation why the public health authorities have not thoroughly investigated the cause of this persistent and significant increase in deaths.
If it is not the elephant in the room, i.e. the vaccine then the next likely explanation is the repercussions of the COVID interventions which were widely predicted by those outside of the official narrative as likely to be more significant than COVID itself.
Due to the shape of the curve in early 2021, it is more likely to be the vaccine. Since the summer, it is equally likely to be the collateral harms of lockdowns and denial of healthcare.
The former should necessitate an immediate halt to the vaccine program, let alone any continued threat of mandates and discrimination against those who wisely chose not to risk taking part in the experiment.
The latter should hopefully inform against implementing the experimental pandemic policies of 2020 ever again.


If only. "Public Health" has become an oxymoron. They have this data, Walensky said it's "not ready for prime time," so they see what we all see. There's a reason they went forward pushing these slapdash injections, all of which coincidentally took the same approach despite being developed "independently" by several companies after quashing known cheap, effective meds with a proven safety record. Don't expect any investigations into anything, the would-be investigators would be signing their own death warrants.
Thank you for your fine work