
Debunking Weather Event Alarmism by Paul Burgess - Climate Realism
Part 4 - Arctic Ice Cover

This article is the fourth in the series:
Part 4 - Arctic Ice Cover Analysis: A Comprehensive Data Review
Summary
This report examines historical data on Arctic sea ice cover, presenting evidence that challenges mainstream narratives about unprecedented ice loss in the Arctic region. The analysis draws on multiple data sources spanning thousands of years, comparing current conditions to historical variability patterns and highlighting key periods of natural climate variation.
Historical Context: Holocene Sea-Ice Cover Variations
Long-Term Perspective (10,000 Years)
Analysis of Holocene sea-ice cover variations reveals significant natural variability over the past 10,000 years. Data from Stein et al. (2017) demonstrates that Arctic sea ice has fluctuated considerably throughout the current interglacial period.
Key Historical Periods:
Little Ice Age: The data shows a notable peak in sea ice extent during this period, representing one of the most significant ice expansion events in recent millennia
Medieval Warm Period: A distinct reduction in sea ice extent occurred during this historical warm period
20th Century: Current conditions appear within the range of natural variability observed throughout the Holocene
Data Characteristics:
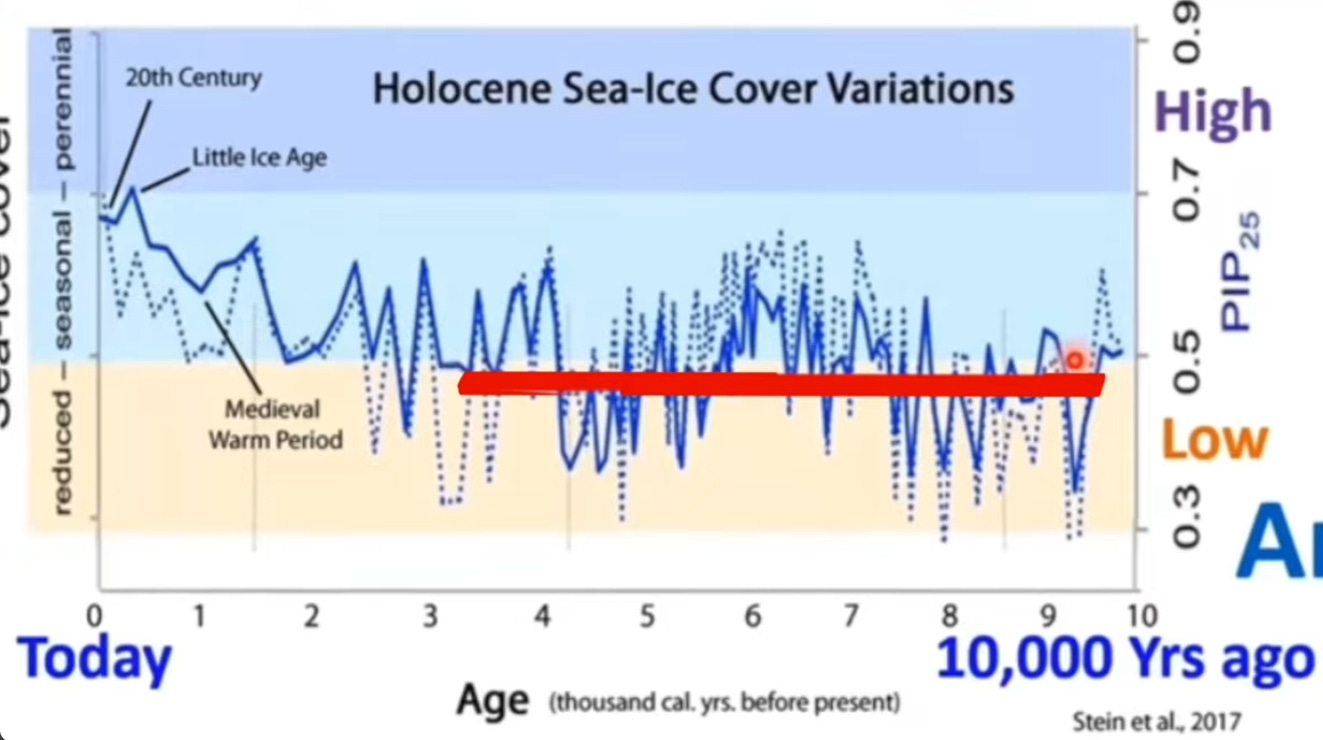
The y-axis measures PIP₂₅ (a proxy for sea-ice concentration), ranging from 0.3 (Low) to 0.9 (High). The analysis notes that “Mother Nature allows lots of variability” in sea ice extent, with substantial fluctuations occurring throughout the record spanning from today back to 10,000 years ago.
Mid-to-Late Holocene Correlation (Last 10,000 Years)
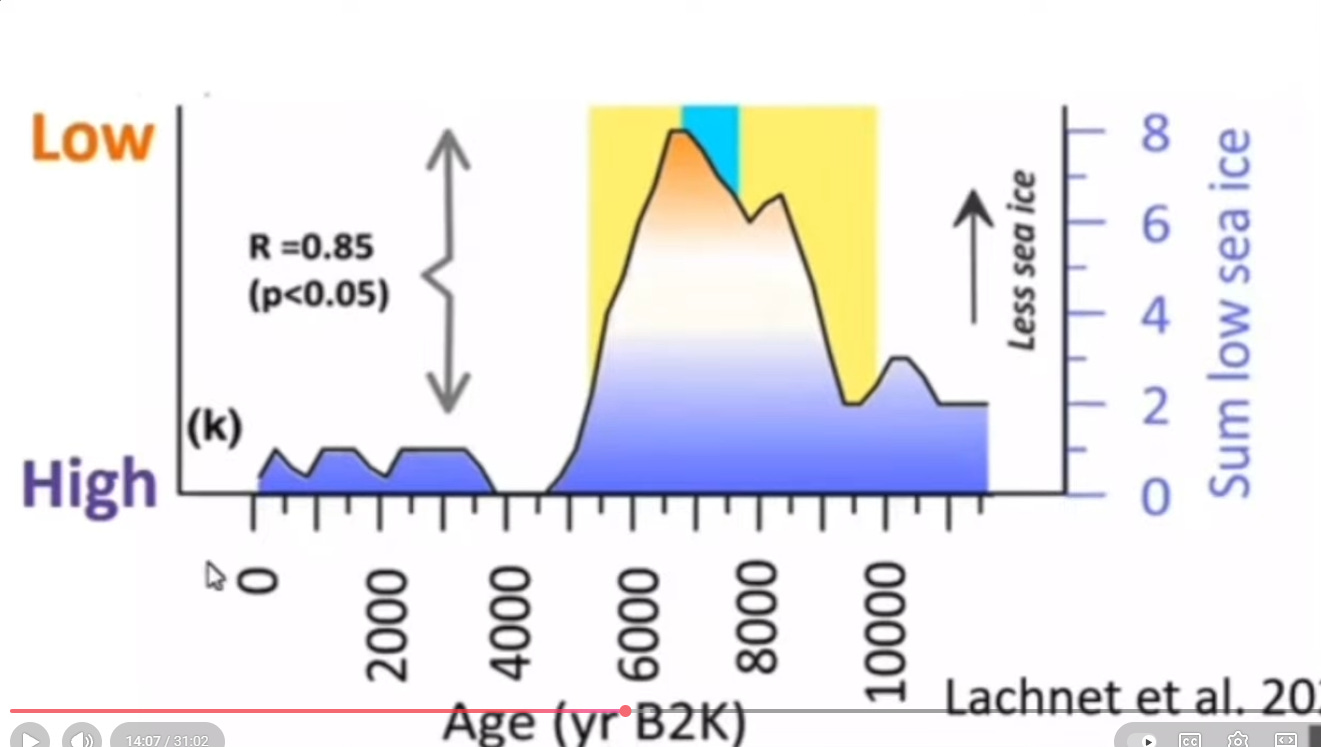
Further analysis from Lachnet et al. (2020s) examined the relationship between sea ice extent and summer low sea ice over the past 10,000 years. This study reveals a statistically significant correlation (R = 0.85, p < 0.05) between these variables.
Timeline Analysis:
0-2000 years B2K (Before 2000): Relatively stable, low sea ice conditions
2000-6000 years B2K: Dramatic increase in summer low sea ice, reaching peak levels around 4000-6000 years ago
6000-8000 years B2K: Decline from peak levels
8000-10000 years B2K: Return to lower baseline conditions
The graph demonstrates that current low sea ice levels are not unprecedented when viewed in the context of the full Holocene record.
Modern Era Analysis: Satellite and Direct Observations
Arctic and Antarctic Standardized Anomaly Trends (1978-2020)
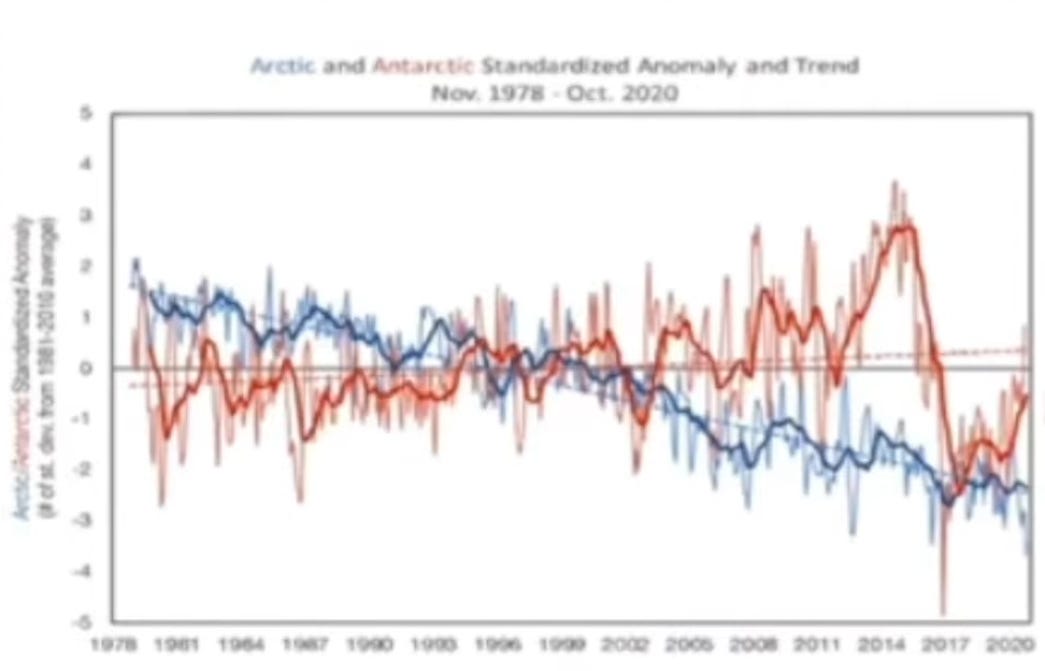
Data from November 1978 through October 2020 shows the standardized anomaly trends for both polar regions. The analysis reveals divergent patterns between the Arctic and Antarctic.
Key Observations:
The red line (Antarctic) shows considerable variability but maintains relatively stable conditions throughout the period. The blue line (Arctic) displays a downward trend, particularly pronounced after 2005.
Both datasets show substantial year-to-year variability, indicating that natural fluctuations remain a significant component of sea ice dynamics even in the modern era.
NOAA 2017 Data: Percent Difference Analysis
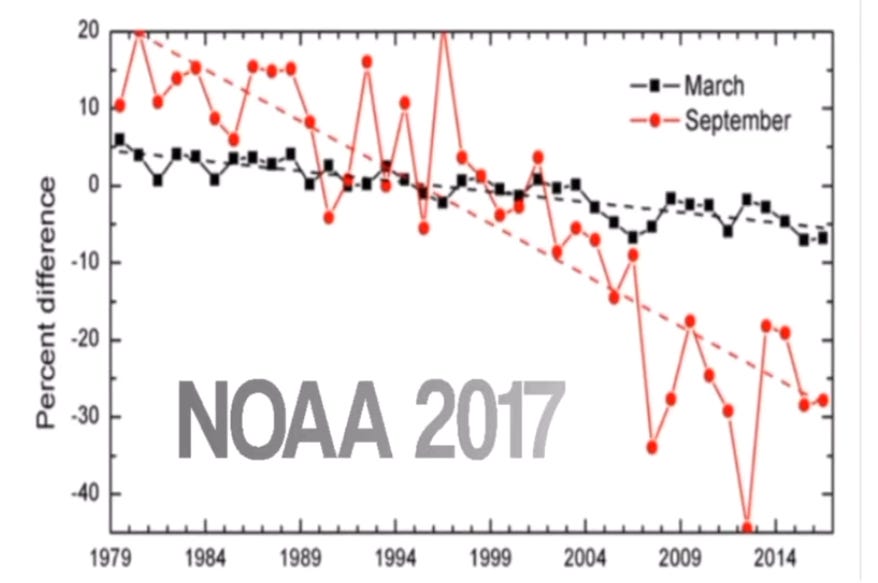
NOAA data from 2017 presents percent difference measurements for March and September sea ice extent spanning from 1979 to approximately 2016.
March Measurements (Black Line):
Generally ranged between +5% and -5% throughout the period
Shows relatively stable conditions with moderate variability
Trend indicates modest decline over the period
September Measurements (Red Line):
Displays much greater variability compared to March
Shows more dramatic percentage differences, ranging from +20% to -45%
Notable decline becomes pronounced after 1999
Sharp drops visible around 2007 and 2012, with September 2012 showing the most extreme negative deviation
The seasonal comparison reveals that September (end of melt season) measurements show significantly more variability and more pronounced changes than March (end of growth season) measurements.
Historical Climate Context: The 1985 DOE Report
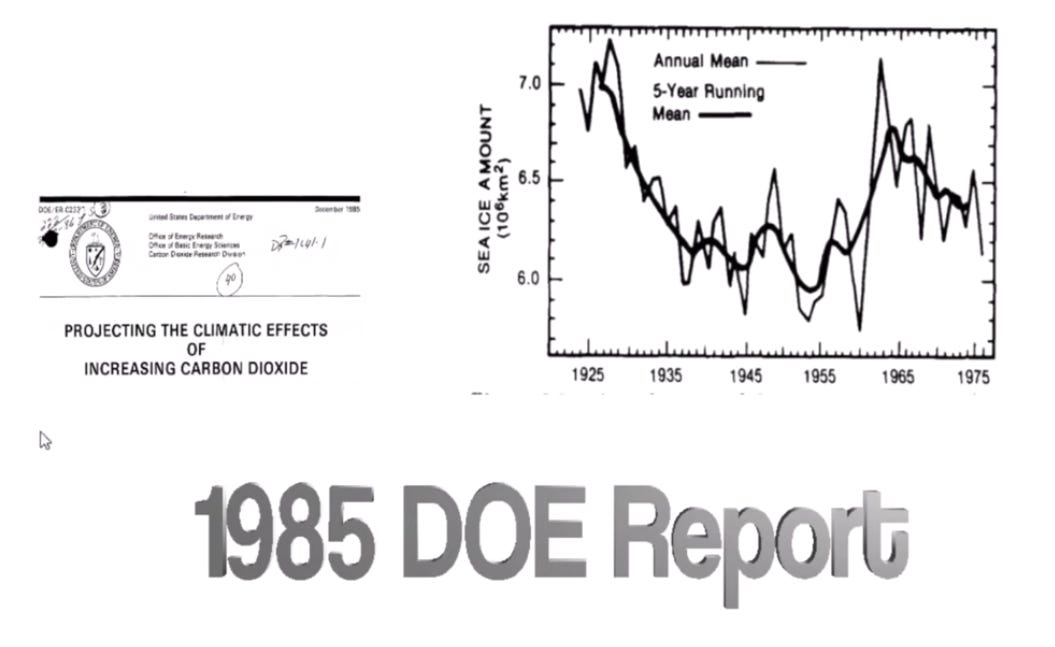
A 1985 Department of Energy report titled “Projecting the Climatic Effects of Increasing Carbon Dioxide” provides crucial historical perspective on Arctic sea ice extent projections and understanding.
Sea Ice Extent Chart Analysis:
The report includes a graph showing sea ice extent from approximately 1925 to 1975, featuring both annual mean and 5-year running mean data. The chart demonstrates:
Sea ice extent around 1925: approximately 7.0 x 10⁶ km²
Significant decline through the 1930s and 1940s
Minimum extent reached around 1945: approximately 6.0 x 10⁶ km²
Recovery period from 1945 through 1965
Peak extent around 1965: approximately 7.0 x 10⁶ km²
Decline beginning after 1965, continuing through 1975
A red circle highlights the year 1979 on an extended version of this graph, marking a significant reference point for satellite era observations.
Critical Context:
This historical data from the 1985 DOE report reveals that Arctic sea ice extent underwent substantial natural variability well before the period of most intensive anthropogenic CO₂ emissions. The decline observed from approximately 1965 through 1979 occurred during a period when climate scientists were concerned about global cooling, not warming.
Historical Arctic Sea Ice Data from IPCC 1990
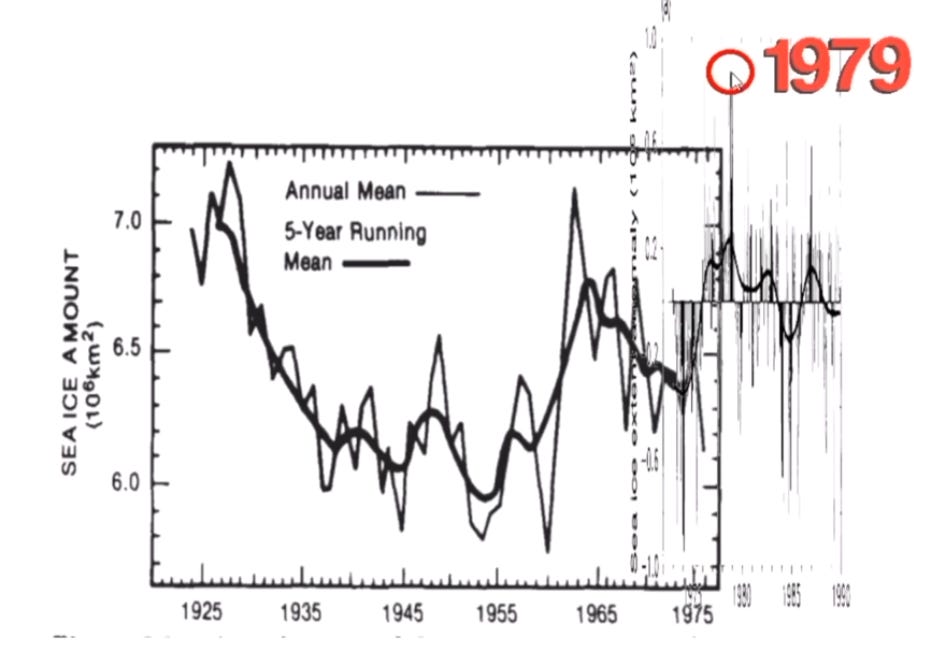
The IPCC First Assessment Report (1990) included data on Northern Hemisphere and Southern Hemisphere sea ice extent anomalies. Figure 7.20 from this report shows sea ice extent anomaly measured in 10⁶ km².
Key Observation:
The data shows that 1979 represented a period of relatively high sea ice extent. This is significant because 1979 is commonly used as the baseline year for modern satellite measurements of Arctic sea ice. Using a high point as a baseline naturally makes subsequent measurements appear as declines, even if they represent returns to more typical historical levels.
Conclusion
This analysis reveals several critical findings:
Natural Variability: Arctic sea ice has exhibited substantial natural variability throughout the Holocene period, with the Medieval Warm Period showing low ice extent and the Little Ice Age showing high ice extent.
Historical Context: The 10,000-year record demonstrates that current conditions, while representing a decline from recent peaks, are not unprecedented in the longer geological context.
Baseline Issues: The choice of 1979 as a baseline for modern measurements is problematic, as this year represented a local maximum in sea ice extent following a period of recovery from mid-century lows.
Pre-Industrial Variability: Significant Arctic sea ice variations occurred throughout the 20th century, including major declines in the 1920s-1940s, well before the period of intensive industrialization and CO₂ emissions.
Correlation vs. Causation: The strong correlation (R = 0.85) between various sea ice metrics over millennial timescales suggests that natural forcing mechanisms have played dominant roles in Arctic ice dynamics throughout the Holocene.
Dedication
This analysis is dedicated to Tony Heller for his work in exposing what the narrator characterizes as fraud behind Arctic sea ice narratives.
Data Sources Referenced:
Stein et al., 2017
Lachnet et al., 2020s
NOAA 2017
U.S. Department of Energy, 1985: “Projecting the Climatic Effects of Increasing Carbon Dioxide”
IPCC First Assessment Report, 1990 (Figure 7.20)
Slightly Off-topic...but I find that exercising my natural scepticism on the subject of "chemtrails" tends to produce a response akin to prodding a wasps' nest with a pole...
It is good to see the context in relation to Artic ice cover, home to 'cuddly' polar bears and flocks of 'cute' penguins...all in danger of losing their floating homes to man's careless consumption of fossil fuels. David Attenborough, friend and protector of 'cuddly' and 'cute' may as well narrate with an ensemble of violins as background. Cute of the 'climate crisis club' to choose a high point in 1979 to construct a doom laden ice narrative.
The subject of 'context' is never brought up let alone analysed by msm. It's what they choose to present and be damned.