England & Wales - Pandemic of the Vaccinated
If the first 2 doses don't get you, the booster will.
Dead people don’t lie.
In fact, they can tell you a lot of truth from the grave.
Like, the course of the COVID epidemic in England & Wales and the impact that mass “vaccination” has had on deaths across all ages.
Let’s start with the children.
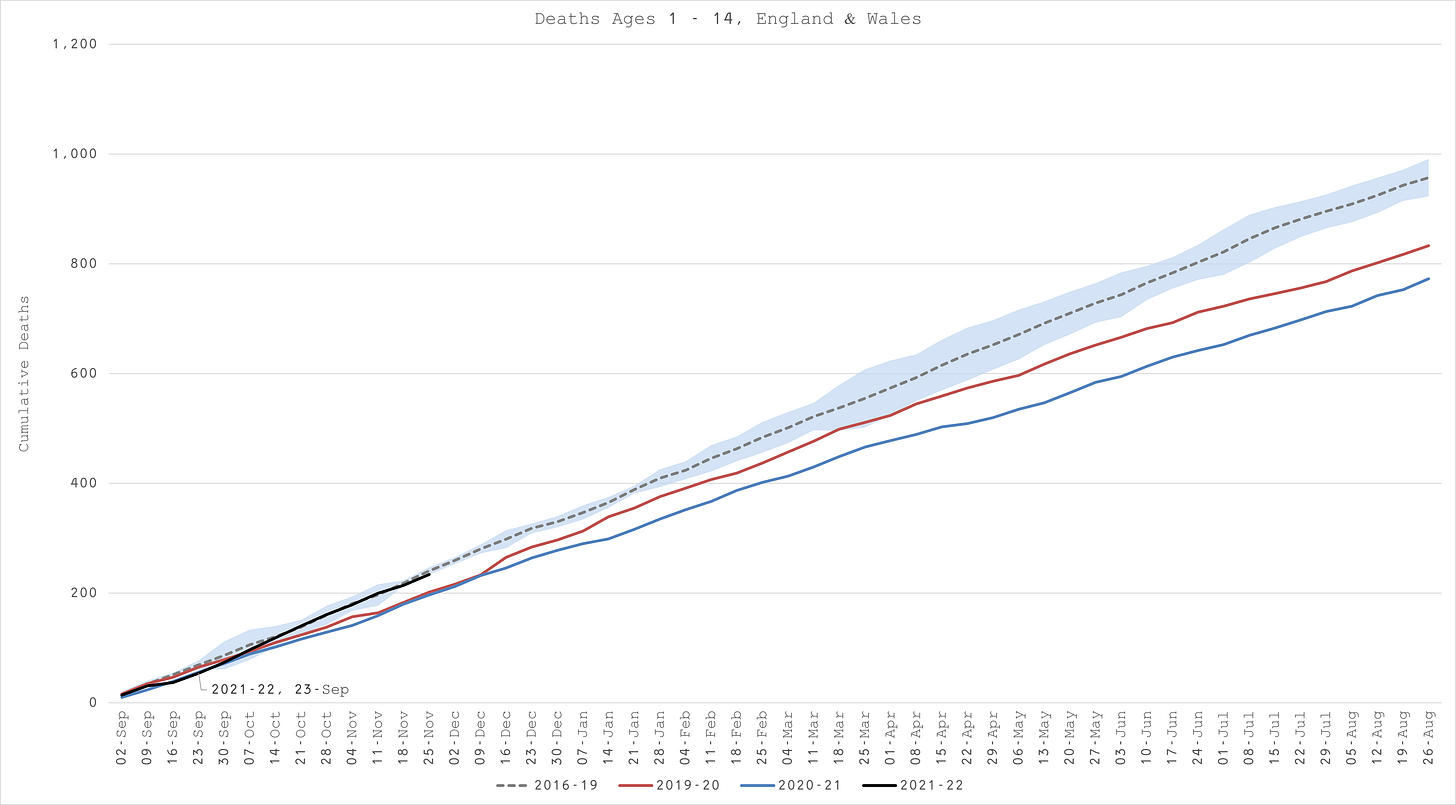
Mercifully, COVID-19 has had no impact whatsoever on child mortality. On the contrary, deaths in 1 to 14 year olds have been substantially lower than the previous few years during 2020 and most of 20211.
Unfortunately, that trend stopped on 23-Sep-21. Coincidentally, that was the time that COVID vaccines were given to 12-15 year olds but like I say, it’s just a coincidence. Since then, deaths have risen from 28% below average to 2% above. But perhaps we’re just playing catch up.
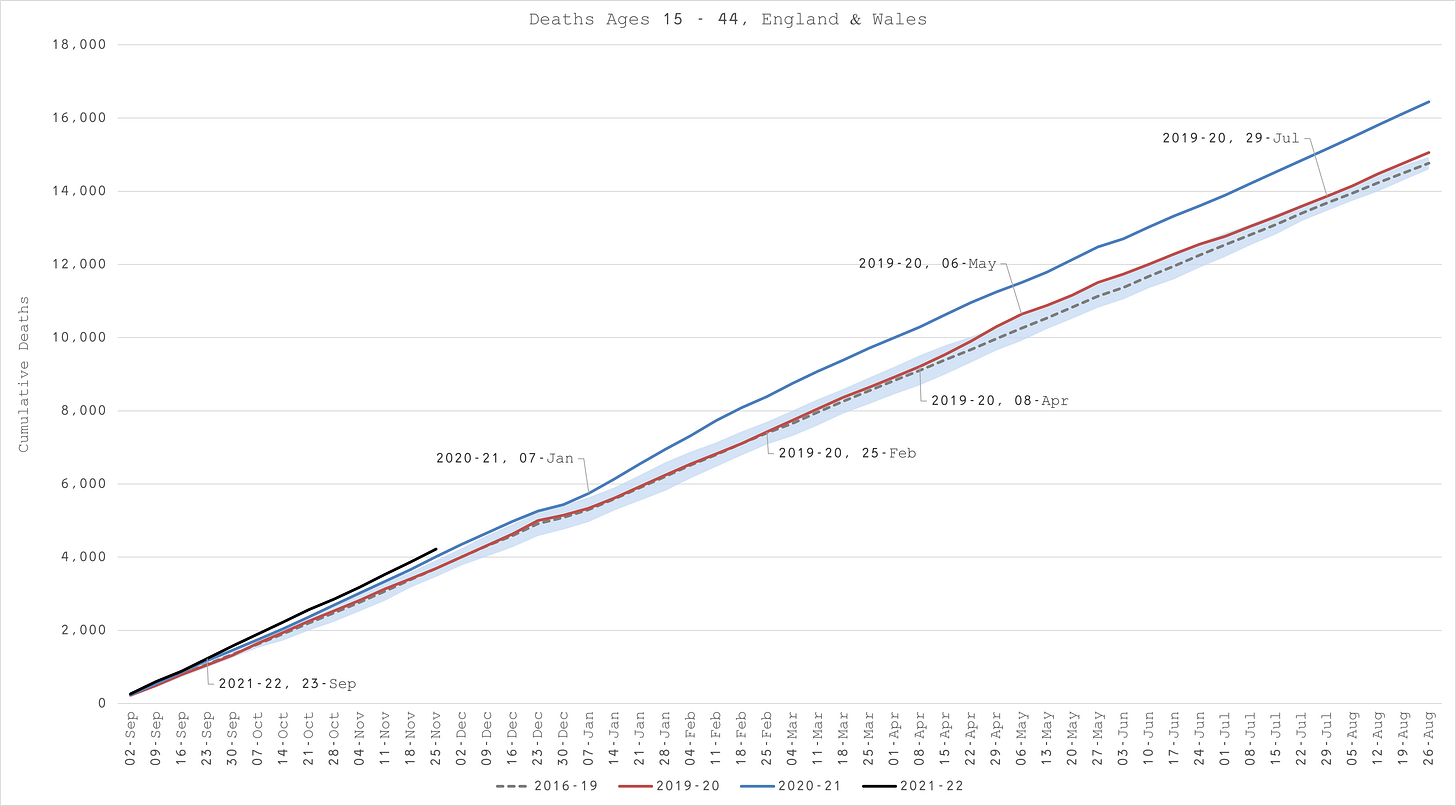
The 15 to 44 year old deaths give us a better overall picture of the impact of COVID and COVID vaccinations.
Deaths begin to diverge ever so slightly above average on 25-Feb-20. Could this have been the real start of the epidemic? But they don’t deviate statistically until 08-Apr-20, a couple of weeks after lockdown and de facto shutdown of healthcare in the UK.
By 06-May-20, the epidemic is over in terms of excess deaths (389), signalling the virus was defeated (by a combination of herd immunity and seasonality) around mid-April. Thereafter, excess deaths decline steadily.
By 29-Jul-20, around half of those excess deaths have disappeared, indicating that they were pulled forward by a few months at most. This is really important when considering lost life-years as a metric rather than absolute number of deaths.
In 2020-21, deaths in this age group start and continue above average, in fact tracking 2 standard deviations above. This constant excess is symbolic of a perpetual event of higher mortality, like the repercussions of COVID policies, rather than the periodic outbreak of a pathogen such as we saw in 2019-20.
However, where we do see a significant inflection, signifying a particular exogenous event, is on 07-Jan-21. Again, this is coincidental with mass vaccinations. Two coincidences now then in different age groups at different times. Perhaps, time to investigate causality properly?
This increase in excess mortality has continued to climb to the present date with another observable inflection on 23-Sep-21, concomitant with the roll out of boosters for eligible people. I presume there would be some “vulnerable” in this age group that would be eligible.
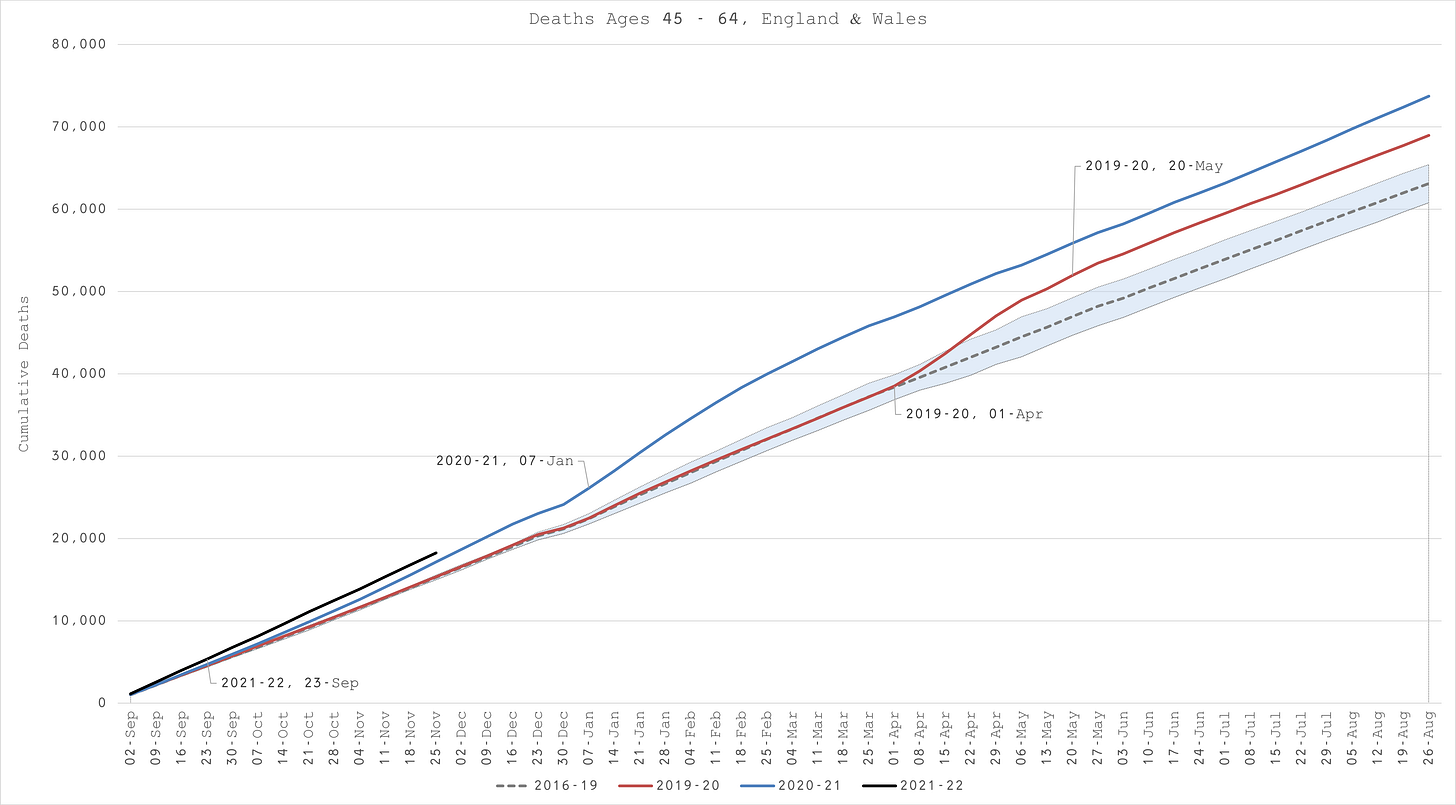
There is much the same story in the 45 to 64 year olds.
Some notable differences.
There is no apparent deviation from expected mortality in Feb 2020.
COVID mortality hits 1 week sooner than the younger age group on 01-Apr-20 and finishes 2 weeks later on 20-May-20. This would be expected for an older (and therefore more vulnerable) cohort.
Unusually, there appears to be no apparent pull forward of deaths.
Otherwise, since 07-Jan-21, since the start of mass vaccinations, like the younger age groups, deaths have been at unprecedented levels.
For the 65+, there are slight variations in timings but otherwise the same story. Notably, almost all the excess deaths are in these age goups. It has been very well known since Feb 2020 that COVID was only a significant risk for the old and infirm after all.
What can we conclude from this?
In the 1 to 14 year olds, COVID (during 2020 and most of 2021) has had no detrimental impact on deaths whatsover but for whatever reason, since Sept this year, deaths are back at normal levels. Apart from a benign return to normality, the only major “event” has been the roll out of COVID vaccines to this age group.
In the 15 to 74 year olds, the year of the COVID epidemic has less damage in terms of deaths than the subsequent year despite COVID showing clear signs of being naturally defeated and “despite” mass vaccination with a “vaccine” that we keep being told is “safe and effective”. On the evidence, it is neither. In relative terms, the 45 to 64 year olds have suffered worse than any other age group over the course of the last year, since vaccines were rolled out.
In the over 75s, COVID had a material effect (with a little help from government policy to deny healthcare and some questionable “treatments” of the old and infirm) in 2020. In 2021, things were not so bad but so far in 2021-22, things are worse than ever. I think I’ve said enough so I’ll leave you to draw your own final conclusion on that.
All data courtesy of the Office for National Statistics (https://www.ons.gov.uk/peoplepopulationandcommunity/birthsdeathsandmarriages/deaths/datasets/weeklyprovisionalfiguresondeathsregisteredinenglandandwales) with no modelling whatsoever. All analysis my own.


Interesting analysis. Just took a quick look at the Australian data and seems to follow a similar pattern. Covid deaths in Aus is very low (<1000 in total). Mass vaccine push mid this year and seems to be an increasing gradient in deaths at around that time. Would love to see your analysis of this. Another interesting analysis in Australia would be to look at States with no covid + no lockdowns (like Qld and WA). There's an obvious increase in deaths (5-10%), but I'm not sure if statistically significant. Part may be due to population growth (<1%). Only other obvious attributing cause would be vaccines. Data published here https://www.abs.gov.au/statistics/health/causes-death/provisional-mortality-statistics/latest-release#data-download
Nice job Metatron!