Hugging your gran didn't kill her but getting vaccinated probably did.
Empirical analysis of symptomatic COVID and COVID deaths in England reveals no positive impact of any interventions but 100% concurrency between vaccinations and COVID "outbreaks" in late 2021.
Main Points
Each distinct COVID outbreak or “wave” can be characterised by a simple, continuous function. There is no empirical data that sits below these functions so there is no evidence of any external factor that mitigates transmission, not school/business closures, nor lockdowns and mask-wearing of healthy individuals, or the vaccine.
Where a new function emerges, it signifies a new outbreak. Every outbreak since Dec-20 is associated with a rollout of the COVID vaccine to various age groups, especially the younger ones.
The case fatality rate is higher in every season since COVID first emerged in spring 2020 indicating that nothing has reduced mortality, not better treatment nor the vaccine.
Introduction
One of the biggest problems associated with COVID data is the use of PCR and LF tests1 to determine infection. Despite neither ever been proven reliable, like many of the dogmatic policies enacted by the government, the data has never been properly caveated as a result.
Fortunately, in England the NHS collects symptomatic COVID reports as part of their syndromic surveillance activities2. In this study, I will compare symptomatic COVID with COVID deaths reported on the Coronavirus Dashboard3, i.e. within 28 days of a positive test and share my insights.
Cases
Wave #1 - Spring 2020
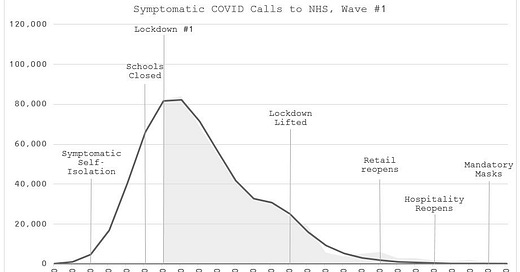
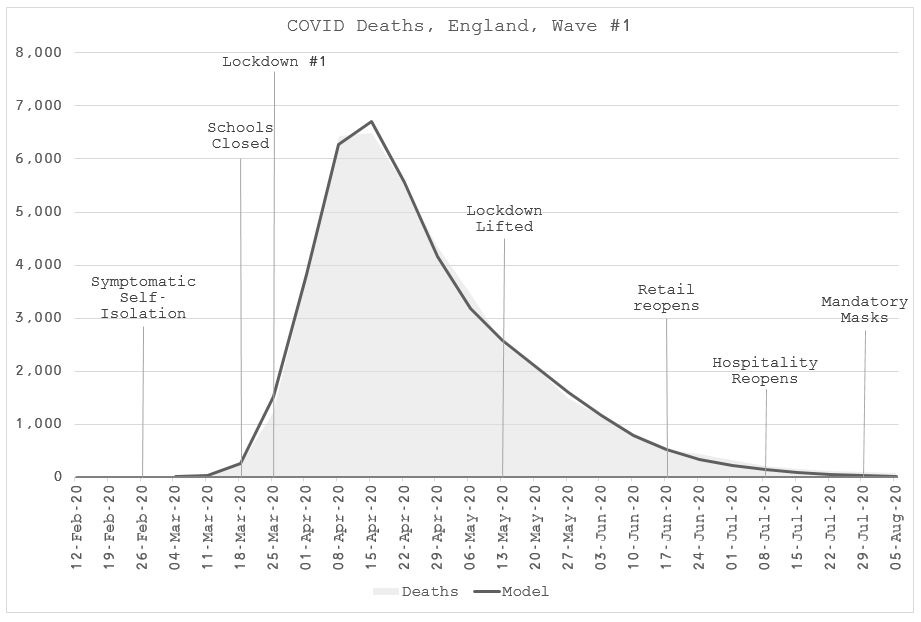
The first observation is that calls to NHS Pathways (999, 111 and 111 online) did not start being properly recorded until the week ending 25-Mar-20 (Figure 1). We know that COVID was circulating well before then because on 26-Feb-20 the government advised those with symptoms to self-isolate.
It so happens that potential symptomatic COVID cases can be modelled with extreme accuracy using my simple Gompertz model4 so I was able to backfill the missing data.
The data was so continuous that only two overlapping Gompertz distributions were required to characterise the entire COVID epidemic of spring 2020.
Already this would be definitive proof that no interventions had any impact whatsoever on spread but we can analyse the outcomes nevertheless.
In Figure 1, if any intervention were responsible for slowing the spread, “flattening the curve” as it were, we would see white space underneath the model curve where the empirical (actual) data was less than modelled expectations.
Evidently, not even advising the symptomatic to self-isolate made any difference to the spread, let alone closing schools and businesses, locking healthy people in their homes or forcing them to wear masks in public. In fact, introducing masks in the middle of summer when symptomatic COVID was pretty much non-existent cannot possibly be considered a “scientific” move.
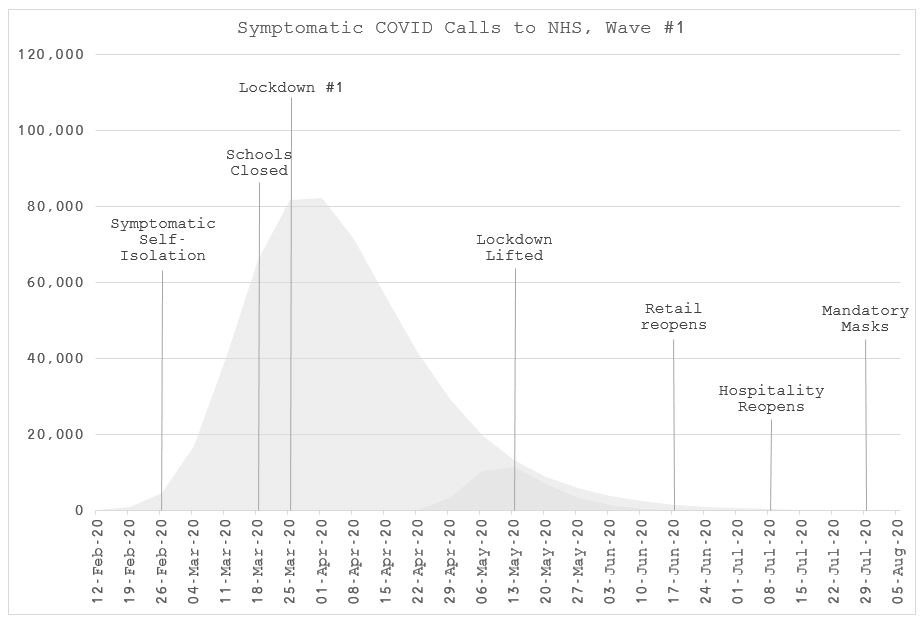
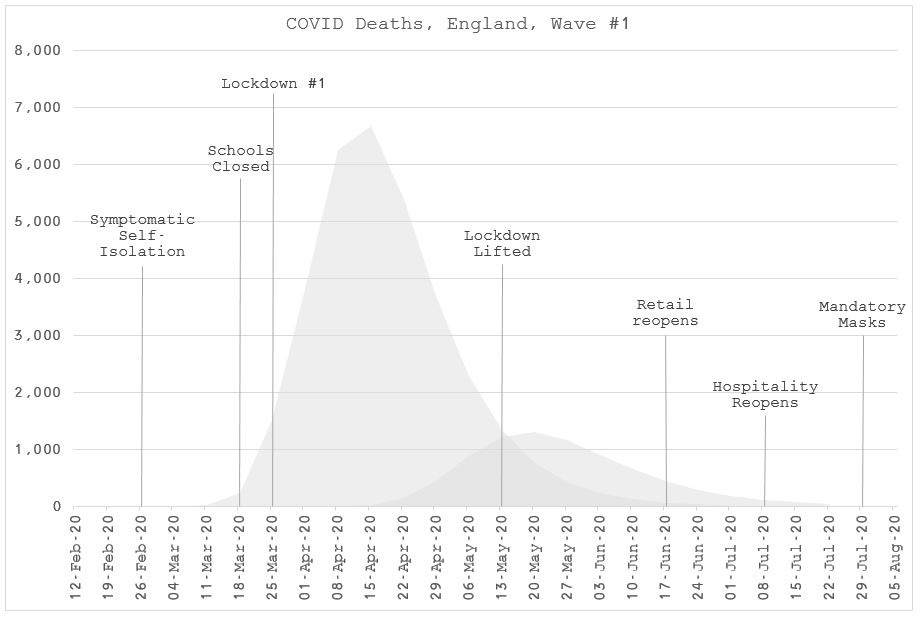
In Figure 2, if any intervention were responsible for triggering a new wave, we might observe this in the form of temporal proximity of the event to the emergence of the new Gompertz distribution.
Evidently, there is one new Gompertz function that starts on 22-Apr-20 but it is not concomitant with any intervention. What we do know, however, is that over 25,000 elderly patients were discharged from hospital to care homes without being tested between 17-Mar-20 and 15-Apr-205.
Otherwise, there is clearly no activity whatsoever when lockdown #1 is lifted in mid-May even though there was still some COVID circulating. This is in very stark contrast to the Imperial College London report by Prof. Ferguson that was used to put all the experimental non-pharmaceutical interventions into practice6 (Figure 3).
Wave #2 - Autumn 2020 to winter 2021
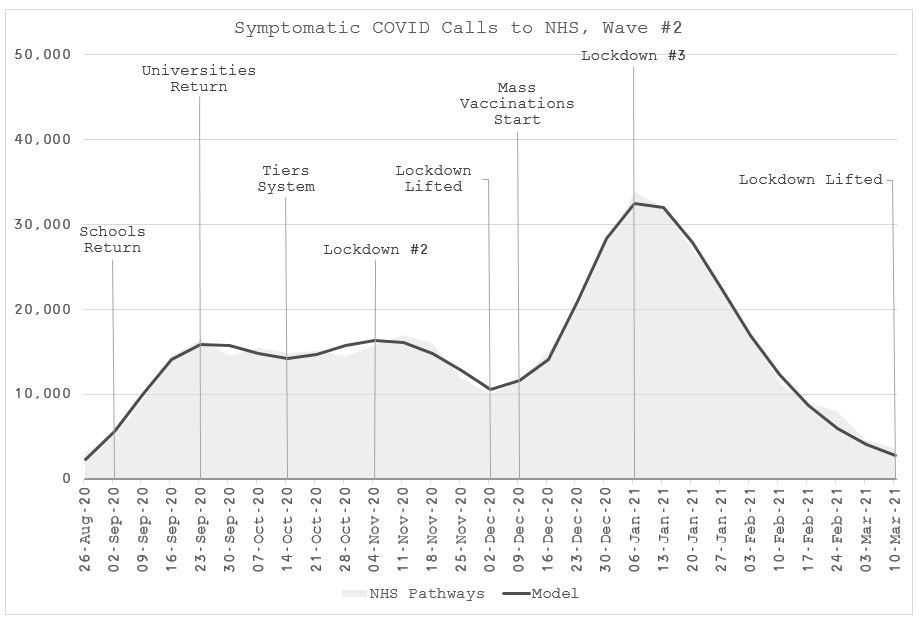
When COVID returns in autumn, just like respiratory viruses do every single year in England, there is again no evidence whatsoever of positive intervention. Inevitably, if lockdowns didn’t work in spring, they wouldn’t work in autumn. And, if lockdowns don’t work then a tiered system of local lockdowns wouldn’t work either!
According to Figure 5, we can see that the autumn wave started at least 1 week before schools returned so that was not the trigger. It does look like the return of university students may have been responsible for the second Gompertz distribution that starts on 23-Sep-20 though.
The biggest distribution starts week ending 09-Dec-20. It is the week that lockdown #2 is lifted and many have claimed that this lifting was responsible. However, since there is no evidence that the lockdown slowed the spread right in the middle of the second distribution, it is a stretch to claim that its lifting was responsible for the third.
The only other potential trigger at that time was the start of mass vaccination. There is plenty of scientific support to explain why outbreaks can occur immediately after mass vaccination since the vaccine does not prevent infection or transmission but does suppress the innate immune system for at least two weeks, making those newly vaccinated more susceptible7.
Wave #3- Summer to autumn 2021
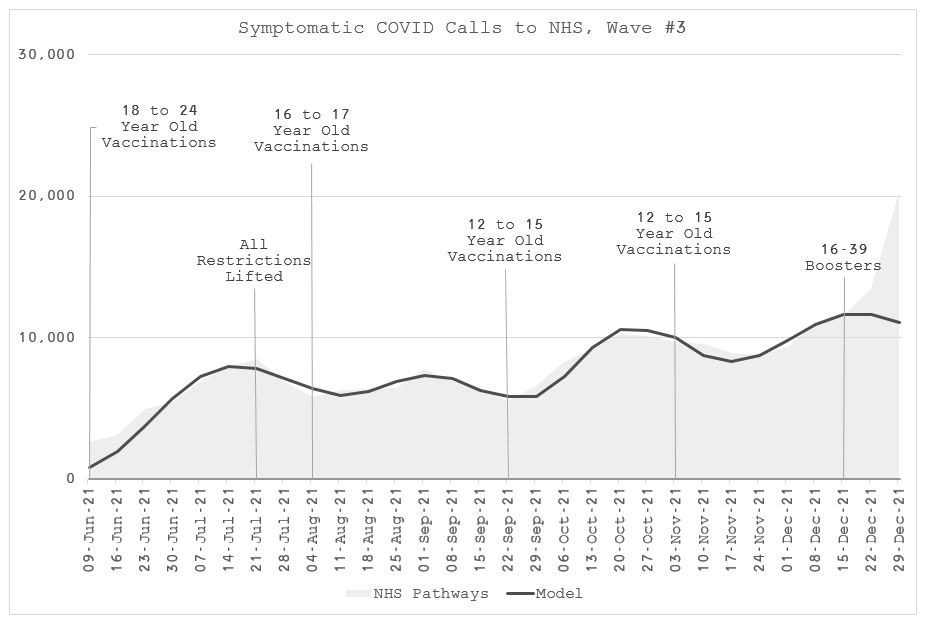
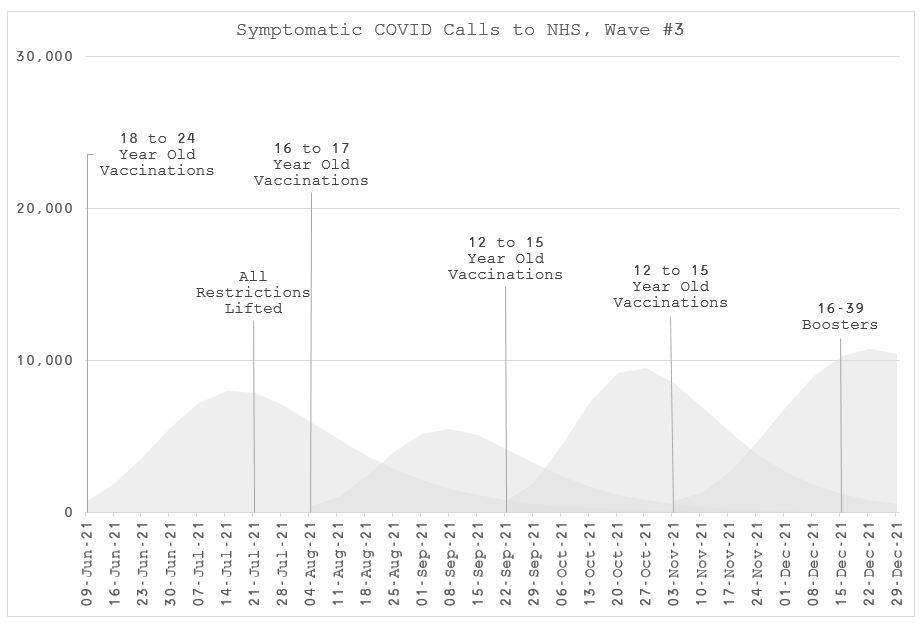
After two seasons of proof that interventions do not mitigate spread, we can turn our attention to the staggered roll out of vaccinations for the second half of 2021 (Figure 6). The main observation here is the fact that there is symptomatic COVID at all. We have demonstrated that it is a seasonal pathogen and it disappeared naturally in summer 2020 so how on earth did it thrive in summer 2021?
Alas, the smoking gun once again is the vaccine. Incredibly there are four Gompertz distributions that characterise the 6 months of COVID outbreaks in the latter half of 2021 and every single one is associated with the start of a vaccination cohort.
The first distribution is triggered by the start of the campaign for 18 to 24 year olds on 09-Jun-21. There is no trigger when all restrictions are lifted on 21-Jul-21.
A new distribution emerges on 04-Aug-21 right when the campaign starts for 16 to 17 year olds. Two new distributions appear to be triggered by the campaign for 12 to 15 year olds on 22-Sep-21 and 03-Nov-21 (the rollout had two very distinct low points 1 week prior to these dates).
Finally, there is a spike on 22-Dec-21 concomitant with a spike in boosters for 16 to 39 year olds on the same date.
You might wonder why there are outbreaks concomitant with these younger cohorts but not the older ones. There is also plausible explanation for this in the science. The youth are much more at risk of damage to their innate immune system due to vaccination and they rely on that more than their under-developed adaptive system8.
So, there appears to be a very strong case suggesting that every COVID distribution since the vaccines were first administered in the second week of December 2020 was triggered by the vaccine.
Deaths
Wave #1 - Spring 2020
COVID deaths inevitably follow symptomatic cases and we can characterise these with Gompertz distributions perfectly too (Figure 8).
We have already shown that interventions completely failed to stem transmission so it is no surprise that there is no exogenous impact on deaths either.
Looking at the individual distributions, we can see that deaths first occur 4 weeks after the first outbreaks but almost immediately after the second outbreak. This would suggest that those affected in the second outbreak were significantly more vulnerable. This fits with the hypothesis of seeding the care homes.
Wave #2 - Autumn 2020 to winter 2021
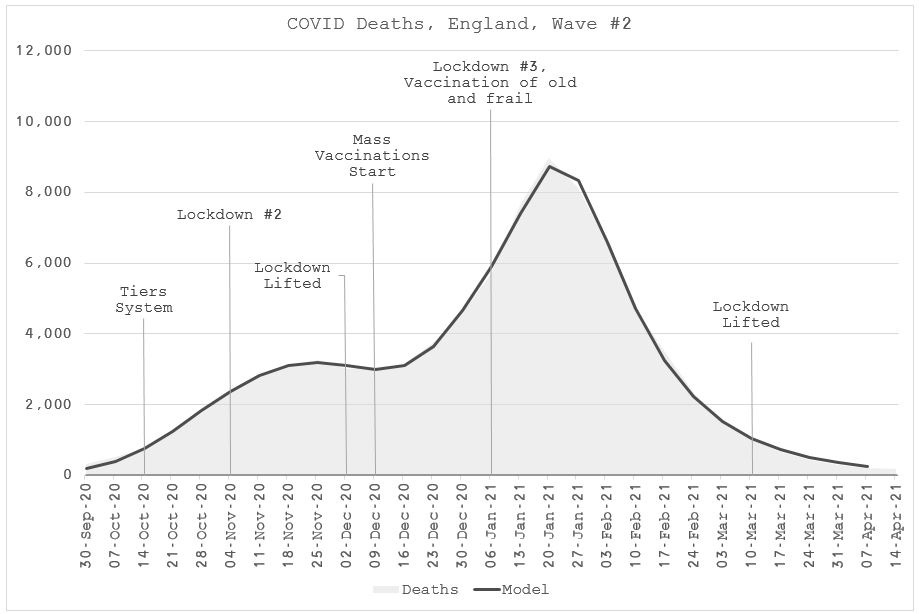
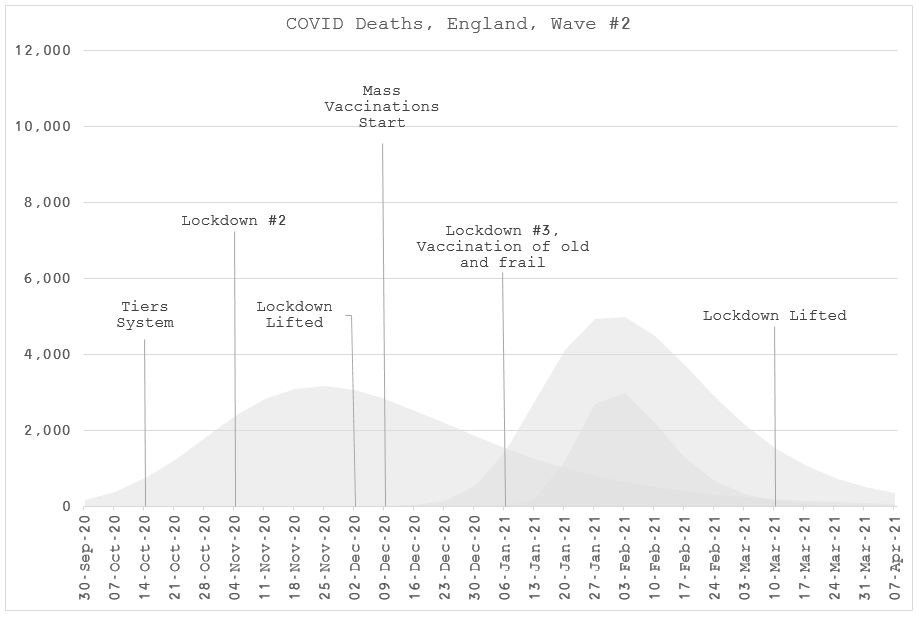
The Gompertz distribution perfectly characterises all the COVID death between Sep-20 and Apr-21 as well (Figure 10). There is no intervention that mitigated death even though there were quite a few fully vaccinated people by the end of the wave. Evidently, the vaccine did nothing to save them from a COVID death despite them being the most likely to die without the alleged protection.
Indeed, there were over 400,000 people aged over 70 years old who were fully vaccinated by 17-Mar-21 (including the 2-week grace period for “effectiveness”). During that same period, there were over 36,000 deaths. Even with 90% effectiveness, there should have been a very apparent deficit in the actual data compared to the Gompertz distribution.
Conversely, in addition to the death distribution that follows the infection wave triggered by the start of mass vaccination (which prioritised healthcare workers), we can observe a new distribution contained entirely within it which starts exactly when the most elderly and frail were vaccinated. Again, following the science of weakened immunity immediately post vaccination, it is difficult not to attribute this distribution of death directly to the vaccine even if their vaccination did not trigger a new wave of infection. They were simply more vulnerable to the infection triggered by the very healthcare workers who were looking after them.
Wave #3 - Summer to autumn 2021
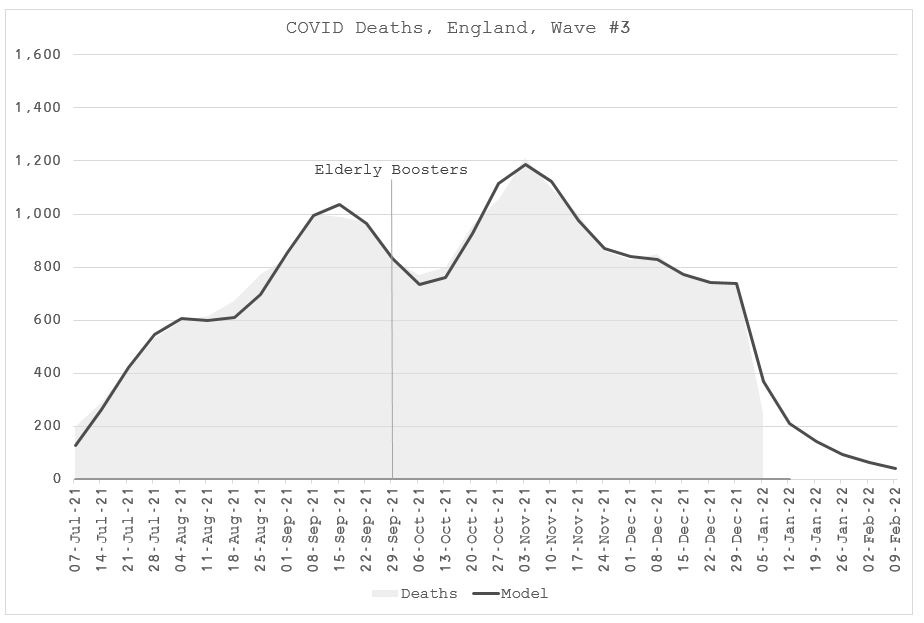
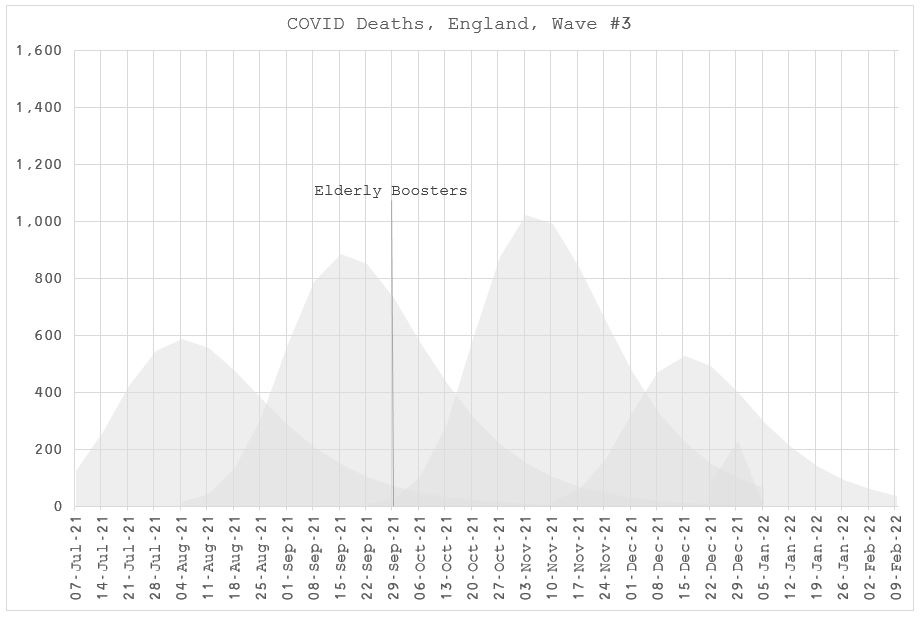
Finally, we come to wave #3, the unexpected wave triggered by the vaccination of young people and children. The distributions each follow the infection waves (Figure 12).
Young people do not die from COVID. Old people do and it seems that the infectious waves triggered by the young people eventually caught up with them. They were told not to hug their granny in case they killed her. They weren’t warned about the societal harm caused by the mass vaccination of children that did not need protection, even if the vaccine afforded it.
It is probably no coincident that the biggest distribution of death occurs right at the point at which the most elderly and frail were given their first booster dose. The scientific research suggest that dose 3 has the same detrimental impact on the immune system as dose 1.
Case Fatality Rate
In summary, we can divide the deaths in each wave to the symptomatic reports to NHS pathways to get a better approximation of case fatality rate (CFR) than that given by the use of positive tests.
It seems that the CFR was lowest when the virus should have been most virulent and when there was less protective immunity for the individual.
The wave #2 CFR is extraordinarily high, almost three times higher than wave #1. COVID deaths are identical to excess during that period9 and there is no reason to expect that the virus should have mutated to be three times more virulent at that time so it is most likely a case of overcounting COVID deaths, another facet of using the PCR test of clinical diagnostics.
Another viable hypothesis is that more infections were acquired nosocomially, i.e. in the hospital setting, rather than in the community, since these would not have resulted in a call to NHS pathways.
If wave #3 is also subject to the same overcounting, there could be a case for positive vaccine effect on fatal outcomes. Alas, if it were true, at best it would be a Pyrrhic victory given the evidence to suggest that without the vaccine there might have been substantially less COVID in the first place!
It could equally be the case that the virus did finally attenuate or simply be the case that with higher cases in the younger age groups, the aggregate CFR would inevitably be lower. Unfortunately, the symptomatic case data is not stratified by age in any detail sufficient so break it down further.
Post Script
As usual, I am less pondering three possible answers to the question why the public health authorities are not doing this analysis:
They don’t have the skills - incompetence;
They don’t have the interest - misfeasance;
They have but didn’t like what it showed - malfeasance.
Have I missed anything?
To casually dismiss these findings as spurious correlations or coincidences would also be inappropriate given that these relationships appear very frequently in the majority of countries around the world in both my own numerous analyses and others10.
https://www.nhs.uk/conditions/coronavirus-covid-19/testing/how-to-do-a-test-at-home-or-at-a-test-site/how-to-do-a-rapid-lateral-flow-test/
https://digital.nhs.uk/data-and-information/publications/statistical/mi-potential-covid-19-symptoms-reported-through-nhs-pathways-and-111-online/latest
https://coronavirus.data.gov.uk/details/deaths
https://en.wikipedia.org/wiki/Gompertz_function. The main significance of using this function is that it is a continuous function with just two parameters, an initial growth and a decay rate. It means that any point that if it fits a set of data well, there is very little exogenous influence on the data.
https://www.independent.co.uk/news/health/coronavirus-care-homes-nhs-hospital-discharges-deaths-a9544671.html
https://www.imperial.ac.uk/media/imperial-college/medicine/sph/ide/gida-fellowships/Imperial-College-COVID19-NPI-modelling-16-03-2020.pdf
https://vector-news.github.io/editorials/CausalAnalysisReport_html.html






Good work Joel.
It is quite extraordinary that pretty much the entire sequence can be explained by expressing viral waves using Gompertz distributions, which itself tells us that each wave is strictly self-limiting (and, as you show, immune to practical intervention - what a surprise for an airborne virus when there is already a high degree of natural immunity ), and recognising that vaccines are, in fact, key explanatory variables.
Even allowing for the distortion of many of the target variables, for example, "infections" and "CV-19 deaths", the analysis is compelling.
One thought; with regard to the full impact of the vaccines on mortality, it would be interesting to use all-cause deaths as the target variable, not least because that is less easily manipulated than flakily defined (manipulated) "CV-19 deaths". That would also make it easy to trace sequential vaccine impact by age group since that is how they were rolled out.
Finally, it might be interesting to include the data for the widespread use of the euthanasia drug of choice, Midazolam (something like two years supply used up in just three months, largely targeting the elderly), one of the other great scandals in this very sad saga.
First off, thank you for writing out this unfolding disaster. There is so much here to think about but the most important thing I wish people paid attention to right now is taking this hypothesis very seriously because it has consequences right now!
"The youth are also much more at risk of damage to their innate immune system due to vaccination and they rely on that more than their under-developed adaptive system⁶."
I posted just a little bit of "evidence" (raw data abused through regression modeling) from Nick Andrew et al.'s Supplementary (suppressed) Appendix showing epidemic spread during vaccination of 12-15 and 16-17.
https://www.gettr.com/comment/cfky3g2daf
The vaccination of children is going to blow up everything very soon. UK will find out, India will find out, so will Israel.