
ONS: monthly age-standardised mortality rates (ASMRs) for deaths involving COVID-19 consistently lower for second dose vaccinated at least 21 days ago compared with unvaccinated, across all ages
Cavē the caveats!

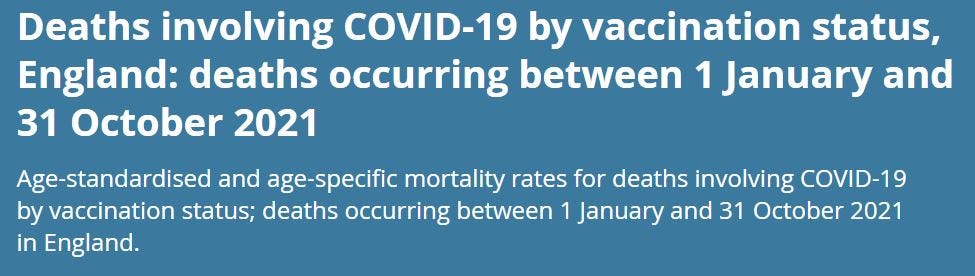
The ONS has released version 3 of their “Deaths involving COVID-19 by vaccination status, England”1, now covering deaths occurring between 1 January and 31 October 2021.
Before the shills and state-sponsored propaganda machines start using the “Main Points” to wish an untimely death on us pesky unvaccinated, I think there are some really serious issues to address2.
1. Non-COVID ASMR risk reduction
I credit the ONS for some reasonable caveats against using this data to demonstrate vaccine effectiveness.
Nevertheless, I am surprised that throughout the report, there is no mention whatsoever, let alone an attempt to explain why the over 30s vaccinated should have a substantially lower non-COVID mortality rate than the unvaccinated.
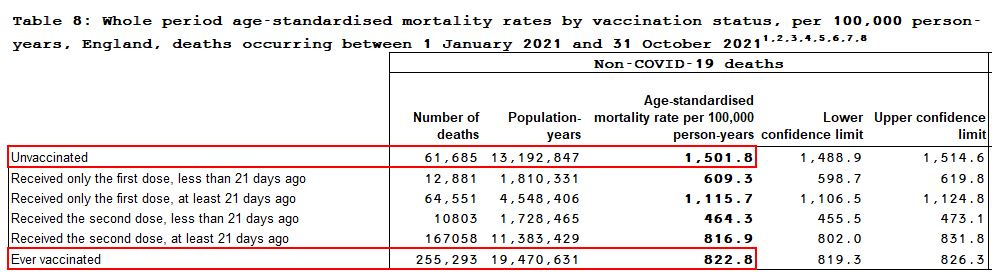
Whatever the reason might be, it is a clear and substantial confounder that should have been corrected for. Without such a correction, it would appear that there is false benefit in being vaccinated as opposed to the reality being an idiosyncratic quality of the unvaccinated that leads to higher mortality and may also be linked to the reason why they were not vaccinated.
Since no allowance has been made for this, I would suggest that all the results of the analysis should be treated with an abundance of caution.
2. Wrong endpoint
It may be innocent or simply what they were told to do but focusing on COVID mortality as an endpoint is wrong. All-cause mortality should be the focus of attention because it will encapsulate the fatal risks of the vaccine too, something that only the “anti-vaxxers” seem to be concerned about. Regardless, in overall terms of public health, all deaths should be a concern, not least because 86% of the deaths did not involve COVID.
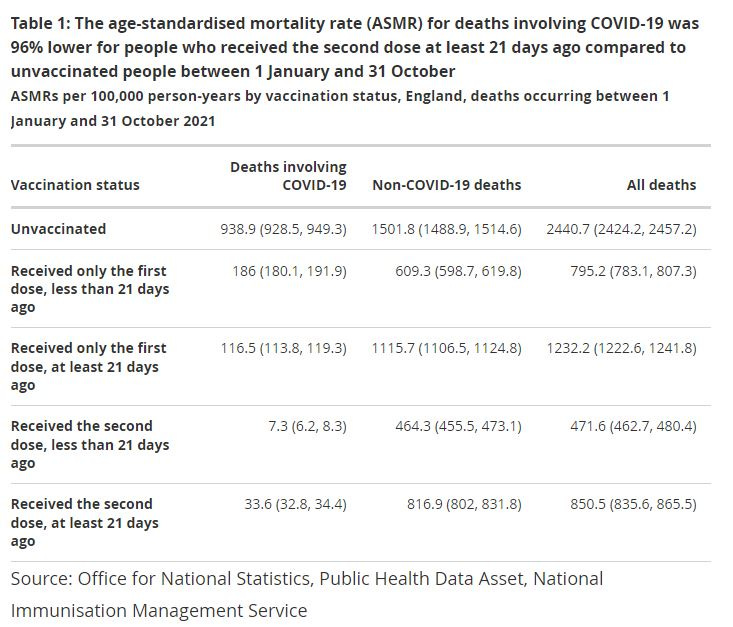
As a result of this myopic focus, all of the “Main Points” refer only to COVID endpoints. Worse still, they even highlight dose 2 plus 21 days as the main highlight (96% reduction compared to unvaccinated), thereby ignoring the obvious survivorship bias in the result due to all those who died (for whatever reason) between dose 1 and that endpoint.
3. No age stratification in the period summary
Everyone knows that mortality rates, especially COVID ones, are strictly heterogeneous across age groups so it’s meaningless to present data that is not stratified by age.
Furthermore, it would have perhaps been helpful to show the “ever vaccinated” results too.
So, I fixed both these issues and was somewhat concerned by the results.
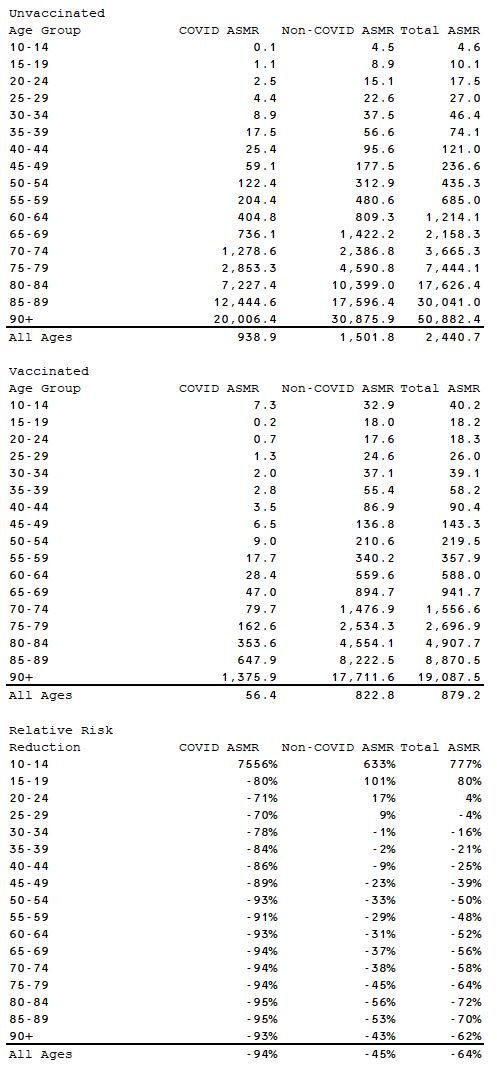
First of all, we can see what appears to be a massive skew in risk for the 10-14 year olds with substantially elevated risk in the vaccinated for COVID and non-COVID mortality, and the 15-19 year olds in non-COVID and all-cause mortality.
Inevitably, there could be some significant confounders in this data (including very small numbers) but, nevertheless, it should have been mentioned since it was included in the aggregate results. Furthermore, in all of the analysis that is broken down by age, the under 19s are conspicuously omitted.
In conclusion, even without controlling for the non-COVID mortality anomaly, it is clear that there is no overall mortality benefit for the under 30s. Since it is also very widely accepted that the vaccines confer no benefit in terms of reduced infection or transmission, the case for not vaccinating under 30s is indisputably closed according to this data.
An argument could also be made for the under 60s where a purported relative risk reduction in all-cause mortality of 50% is borderline for an emergency use therapeutic.
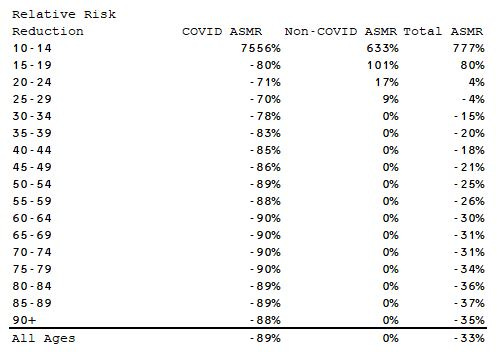
Correcting for the non-COVID ASMR using a combination of unvaccinated population and deaths adjustments so that at the most conservative the vaccinated non-COVID ASMR is no lower than the unvaccinated would call the vaccine benefit across all ages into question.
https://www.ons.gov.uk/peoplepopulationandcommunity/birthsdeathsandmarriages/deaths/bulletins/deathsinvolvingcovid19byvaccinationstatusengland/deathsoccurringbetween1januaryand31october2021
I feel victim to this myself. I was going to entitle the piece “ONS reports 96% vaccine effectiveness in reducing COVID mortality in 2021.” but then realised they explicitly state the results cannot be interpreted as “vaccine effectiveness”. Let’s see what MSM make of it, shall we?
Why do they keep releasing such bogus numbers. Don't they have any more working brain at ONS that can figure that vaccines cannot lower non-Covid deaths ?
Thank you for noting this
"I am surprised that throughout the report, there is no mention whatsoever, let alone an attempt to explain why the over 30s vaccinated should have a substantially lower non-COVID mortality rate than the unvaccinated."
If you look at this really despicable "explanation" for the increased overall all cause mortality in the age group 20-39 https://www.ons.gov.uk/visualisations/dvc1721/fig4wrapper/index.html,
You will notice they did 3 things to obfuscate.
1) They cleverly analyzed the 20-39 together averaging out the higher ASMR in the 20s vaccinated with higher ASMR in 30s unvaccinated.
2) They dropped the most consequential moments of the weeks after vaccination and only showed 21 days after each vaccine dose.
3) They arbitrarily decided to bin people into "Good Health", "Poor health", "Poorest health".
This last one is really bad because you are telling people that if your loved one died, it's probably because they were in bad shape and that the vaccine would have worked for them if they had just been healthier. Really? Then what's the justification to use the vaccine to protect them? More importantly, if we can't know who is in good heath or poor health, how will the vaccine be contraindicated for this group? On the contrary, they are advertising to this group?!!
People should demand that they explain what the parameters of these "health" indicators are or if it's simply "Didn't react well to the vaccine, so must be of poor health, like Sergio Aguero".
Now if I was on twitter, I would ask Prof. Pagel and Dr. Gurdasani if they have any interest in finding out why the children who are vaccinated are dying at 73x the rate from Covid after vaccine. I bet they don't want ONS to do a similar graph for the 10-19s age group because they cooked denominators will show even more glaringly than the "poorer health" graphic I linked where unvaccinated magically start dying during vaccination of different group. (As your paper with Prof. Fenton and group showed).