Re-analysis of COVID-19 vaccine weekly surveillance data in England - Part I: CASES
And how echo chambers and the Dunning Kruger effect can impede good judgement.
She is important to this analysis because very recently, as stoically as Beverley Turner before her, she had the task of taking on Jeremy Vine and Nina Myskow (I actually had to look her up), in a debate about obligatory jabs1.
What really piqued me to write is the reaction she got out of Myskow when she suggested that perhaps she doesn’t know all the facts because she does not look outside of her echo chamber.
I would go further and suggest that both Vine and Myskow also exemplify the Duning Kruger effect2.
So, let’s put the two suggestions to the test.
I’m going to do a deep dive on the limited data that was used to support the debate (Samuels did actually succeed in presenting a reasonable amount when she was allowed to speak), and see if Myskow would like to challenge it, outside of her echo chamber.
These were Myskow’s arguments:
If you are unvaccinated, you are more likely to catch it (60% less likely to catch it if you are vaccinated chimed in Vine).
Being vaccinated protects others as the vaccinated are less likely to pass the virus on.
We’ve heard these arguments many times before and despite the substantial body of scientific evidence that refutes this, many media commentators still seem to be relying on rather old headline data from data analysis like the ONS bulletins which was found to be so biased that the UK Statistics Authority had to step in to caveat it.
I’ve taken the other vaccine effectiveness bulletin3 produced by the UKHSA (formerly PHE) to test the validity of Myskow’s arguments.
Let’s test the first argument, you are more likely to catch COVID if you are unvaccinated. I’m going to use a simple model.
Between 22nd August 2021 and 12th Dec 2021, I’m going to compare the proportion of 4-weekly case numbers of the fully vaccinated stratified by age to the percentage population that is fully vaccinated.
If the hypothesis is true then we should see a lower proportion of fully vaccinated cases than there are fully vaccinated population.
In the 18 to 29 year olds (Samuels’ age group), 25% of the population was fully vaccinated at the start of the study period, rising to 59% by the end. Note that this data is offset by 2 weeks since the surveillance bulletin only counts data as 2-dose 14 days after vaccination. Otherwise, they dump it in dose 1. Yeah, really.
Conversely, the fully vaccinated account for between 28% and 47% of cases. There are caveats that would have to be taken into account, as UKHSA point out themselves about idiosyncratic health characterisitcs of those who are vaccinated and not.
Nevertheless, based on the raw data, you could argue for negative vaccine effectiveness of 3 points at the start of the period rising to plus 12 points by the end.
Whether 12 percentage points merits public disclosure of vaccination status and determines what parts of society you are permitted to participate in is the debate.
In the 30 to 39 year olds, between 48% and 64% of the population is fully vaccinated.
Conversely, between 51% and 66% of the cases are in the fully vaccinated. Well, that’s not compelling to say the least, is it?
In the 40 to 49 year olds, 71% to 76% are fully vaccinated.
79% to 85% of cases are in the fully vaccinated. Well, now we’re getting into territory where the hypothesis to test is whether being fully vaccinated actually makes you more likely to catch the virus, aren’t we?
In the 50 to 59 year olds (I’m guessing we’re into Vine and Myskow’s demographic now?), 84% to 86% are reported to be fully vaccinated.
But again, we’re looking at 88% to 91% of cases in the fully vaccinated, 4 to 5 points more than the vaccinated population. Ruh roh.
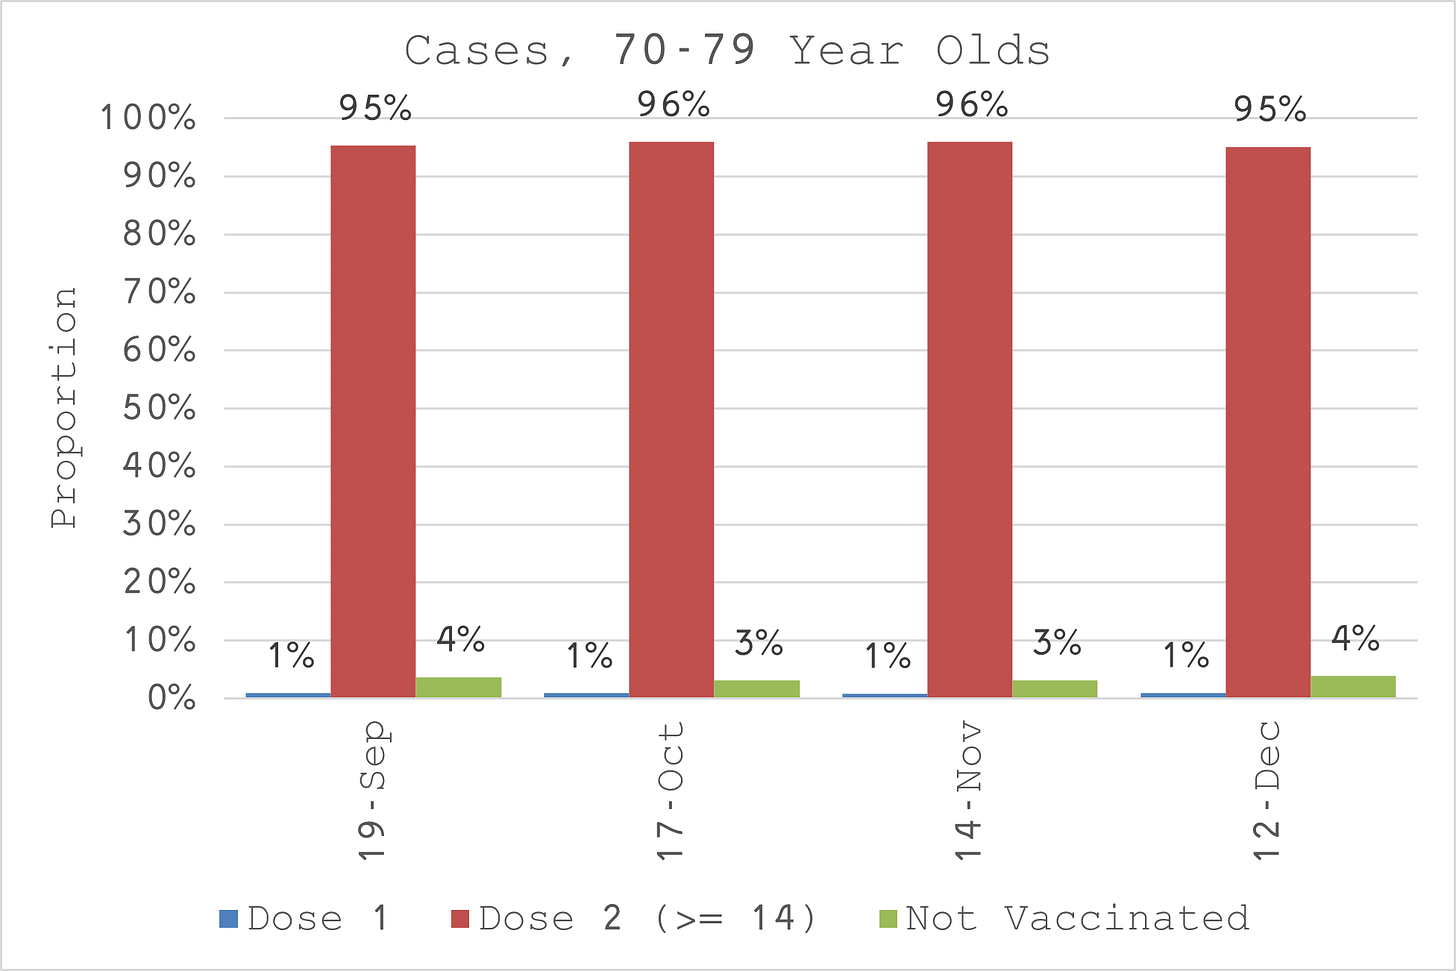
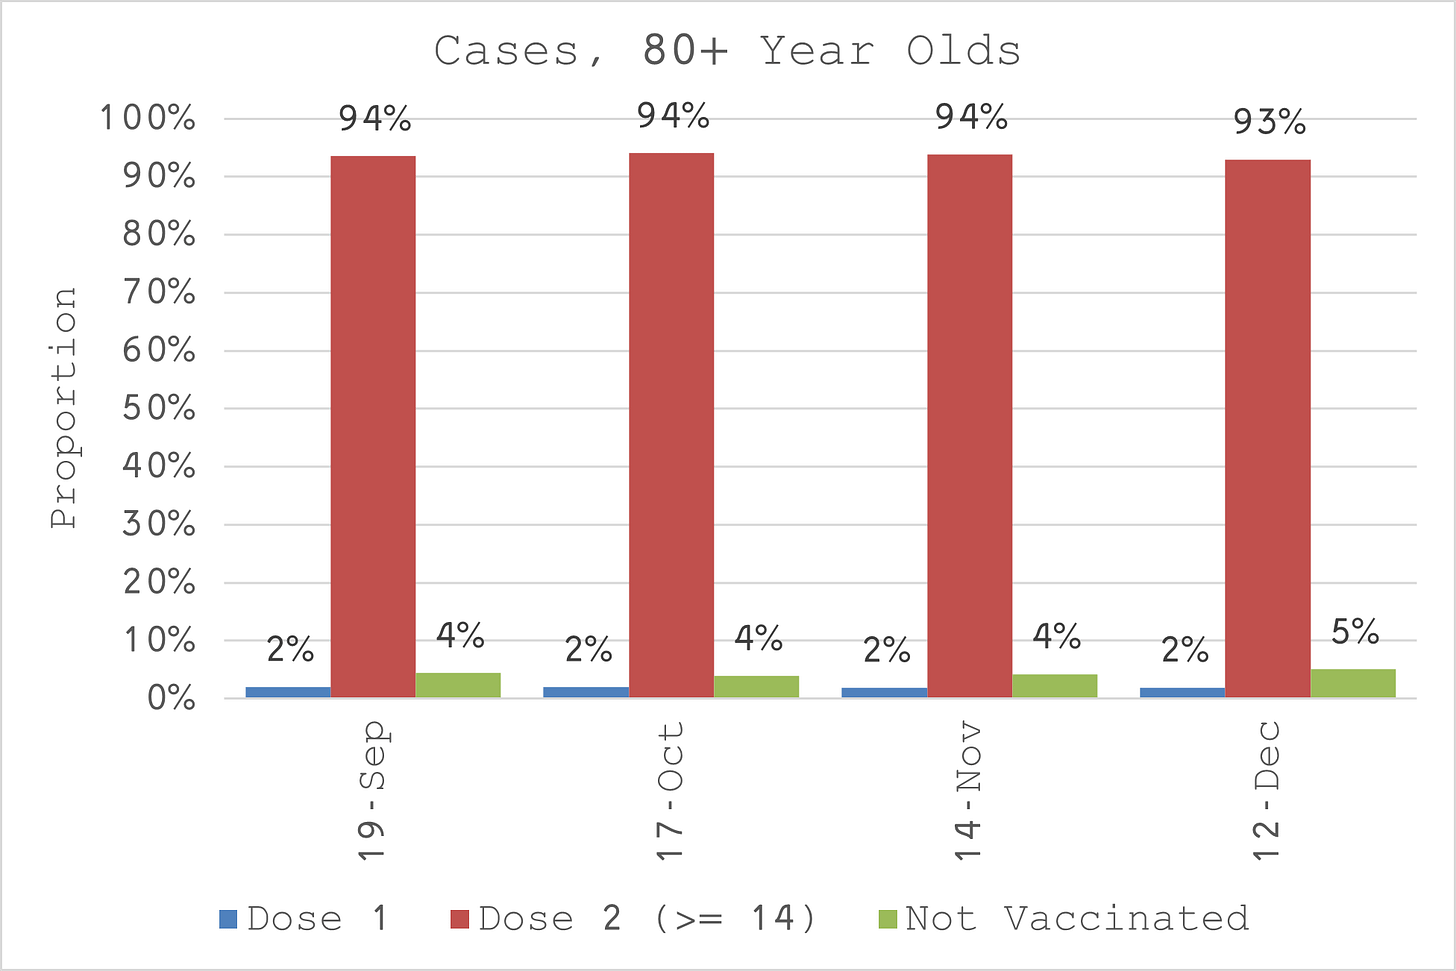
In the over 60s, there is nothing but noise given that over 90% of the population is vaccinated. Sure enough, over 90% of the cases are in the fully vaccinated too.
There is something more we can do with these age groups though. Given that the rate of full vaccination ranges linearly from high in the oldest age groups to low in the lowest age groups, ceteris paribus, we should expect to see a similar linear share of cases by age.
But we don’t. As cases rise across all ages, the 40 to 49 year olds have the highest case rates that decline linearly in the youngest two age groups similarly to the older ones. Furthermore, there is a substantial difference between the three oldest age groups despite very similar, high vaccination rates, suggesting there is a much more significant factor accounting for the variation than the vaccine.
So, as far as point 1 goes, is there evidence that being fully vaccinated makes you less likely to catch COVID? On the basis of the data that has been made publicly available, it would appear not. Indeed, the opposite case is possibly stronger and is also corroberated by “the” science4 5 6 7.
Regarding point 2, are the vaccinated less likely to pass it on? Well, that’s beyond the direct scope of the data in this analysis but logically you cannot pass on what you don’t have (remember that myth of asymptomatic spread has been debunked many times by now too)8. So, I would also conclude on that point, Myskow’s argument again cannot be supported by the data.
I must confess to making the same bias as the UKHSA bulletins in only looking for benefit. For a complete analysis we should also investigate potential harm. If you don’t look for something, you are unlikely to find it but, as it happens, in this case, we did potentially find evidence of harm already, without looking! And once again this is supported by the science9.
In fact, if we look at cases across all ages, there is something else that might appear worthy of further investigation.
We can see very clearly that there is a sharp inflection in cases starting 17th Oct. As much as the COVID that we experienced in the middle of summer was rather unusual, the COVID in autumn is rather expected. We are dealing with an otherwise predictable, seasonal virus after all, not a particularly novel one.
Nevertheless, if you cast yourselves back to the vaccination charts, you might notice something else rather significant that starts a couple of weeks before that? COVID boosters!
In the context of a debate about whether people ought to be obliged to have a booster shot, call it “duty” if you prefer the coercive language of the collective mass formation psychosis10, unequivocally ruling out the possibility that the boosters might actually be causing an increase in cases ought to be the first issue to resolve?
However, on that matter I have further bad news for you. This is a pattern that we have not only seen in England. It’s everywhere you look, regardless of geographic coordinate and timing11.
I am happy to be challenged on merit on any argument I have put forth in this analysis, such is the nature of scientific debate. But one thing I am likely to never be moved on is the expectation that certain members of society feel entitled to breach inalienable rights to privacy and bodily autonomy on the basis of any evidence, let alone an opinion formed more out of dogma and over-estimation of their own competence in the matter.
In Part II, we’ll take a look at the 2nd claim of vaccine effectiveness - reducing serious illness - by examining COVID cases admitted for emergency care.
https://thedecisionlab.com/biases/dunning-kruger-effect/
https://www.gov.uk/government/publications/covid-19-vaccine-weekly-surveillance-reports


Facts are stubborn things.
Merry Christmas, Joel!