

New Zealand's All-Cause Deaths & Mortality by Age & Vaccination Status
New Zealand's All-Cause Deaths & Mortality by Age & Vaccination Status
No statistical significant effect on all-cause mortality by COVID-19 vaccination status. Higher Rates observed in COVID-19 vaccinated during COVID-19 attributed excess mortality periods.

Abstract
All-cause death data by vaccination status released by the New Zealand Ministry of Health (MoH) in response to a FOIA request was analyzed. Data issues were identified and reported to MoH. In absence of a ready to use dataset, a comprehensive population dataset for age/vaccination analysis was curated. The methodology involved extensive data processing, disaggregation, interpolation, and consistency checks to ensure accuracy.
The results revealed insights into deaths, population, and mortality rates by age and vaccination status. Age-stratified mortality patterns and age-standardized mortality rates were analyzed, which showed no statistical significant effect on all-cause mortality by COVID-19 vaccination status. During times of high covid attributed excess mortality, rates were higher in vaccinated groups.
Without evidence of effectiveness, the absence of efficacy implies potential harm. In absence of real world efficacy and the known substantial harms, including the risk of death, an immediate stop is warranted.
Background
On February 15, 2024 the New Zealand Ministry of Health (MoH) released all-cause deaths by vaccination status as requested by FOIA. Since then, I have analyzed and already shared some plots on Twitter. There are some data issues in the MoH response, such as obviously missing deaths, which I have written about here. In addition, the suppression of deaths <5, and the lack of an “ever vaccinated” category, leads to significantly more deaths being suppressed for the vaccinated categories. The FOIA has since been followed up, including a request for population data, this response can take possibly a very long time.
In order to calculate rates by vaccination status, we need population data by age. Of course, none such data exists readily available. Through a couple of different sources & methods, I was finally able to curate a fairly solid population by age/vaccination dataset, which can be used to analyze the death data.
Methods
Data analysis was written in R. Source Code & final datasets are provided at the end of this article.
Deaths
Death figures by vaccination status were downloaded from the MoH FOIA response and parsed to desired format. Suppressed deaths (1-4) were replaced with NA and subsequently interpolated by difference of provided totals and sum of unsuppressed values.
Population
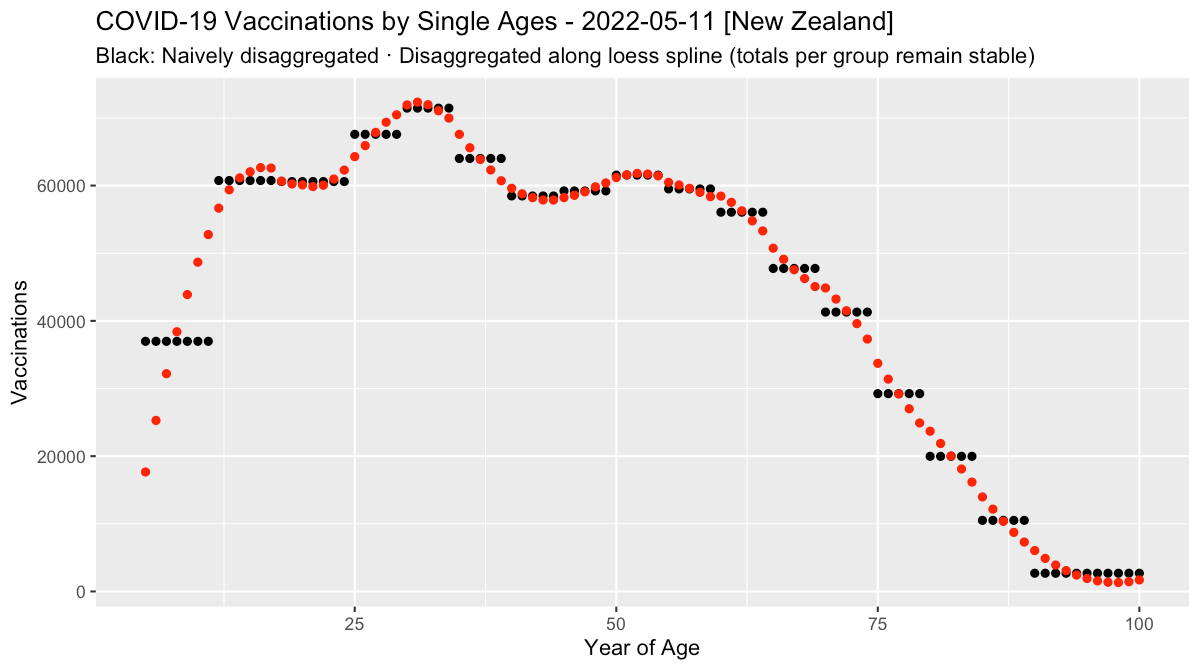
Population data was downloaded from MoH Github and WaybackMachine Archive of the MoH Website for data before August 2021 (compiled by OpenVAET). As the structure of age groups changed throughout the combined dataset and was also different from the target dataset, data were first disaggregated to single age years. For each date, the values of vaccinations by age was iteratively aligned (100x) to a loess smoothed spline, while keeping the total per original age groups identical. The result of the subsequent re-aggregation of the target age groups, should therefore be more accurate. Note, that the suboptimal interpolation at the edges is irrelevant here, because of the large target age groups (0-20, 81+).
Next, the data was interpolated to daily values before being aggregated to monthly values. Lastly, a final consistency check was carried out, making sure that earlier vaccinated figures per age group can never have higher values, than its later counterparts, thus making sure the time series is consistent. (This was already an issue in the original datasets.)
Quarterly total population was also downloaded from New Zealand Statistics Office (NZSO), Table: Estimated Resident Population by Age and Sex (1991+) (Qrtly), interpolated linearly to monthly populations and then used to calculate the unvaccinated population.
As total population age groups in the NZSO dataset ended at 95+, the target age group of 81+ was a necessary consequence, as total population data for 95-99 were thus unknown.
Mortality
With the provided death & population figures, crude mortality (CMR) and age-standardized mortality rates were calculated (ASMR). New Zealand’s own January 2022 population structure was used as the standard population for age-adjustment.
Results
Deaths
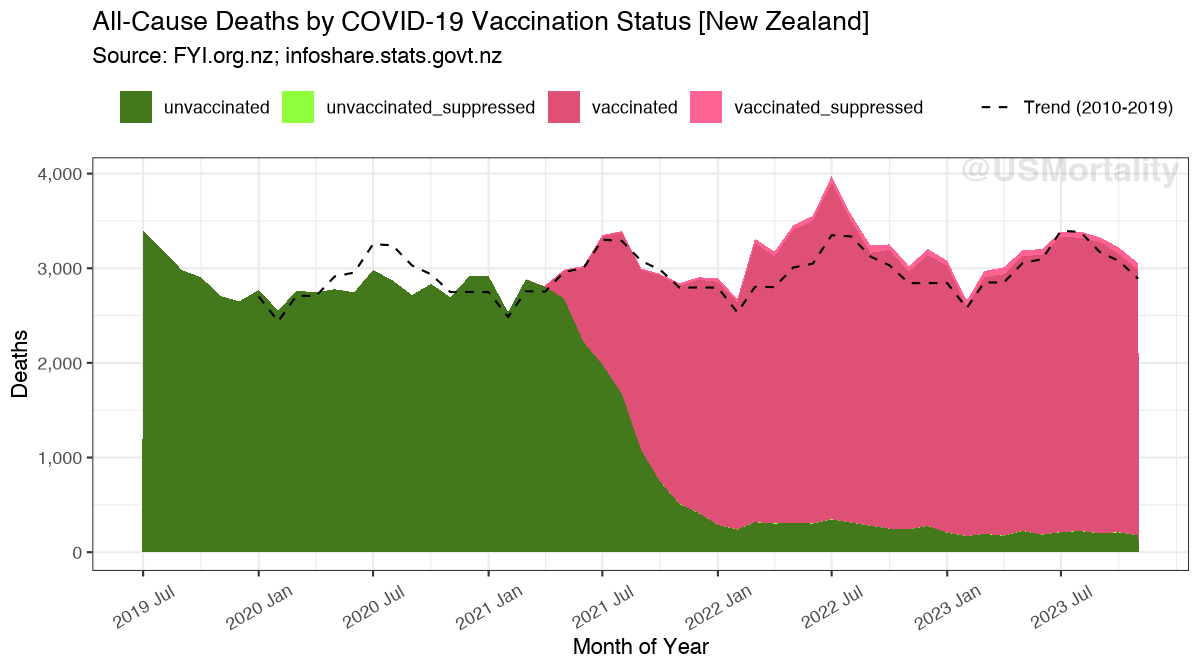
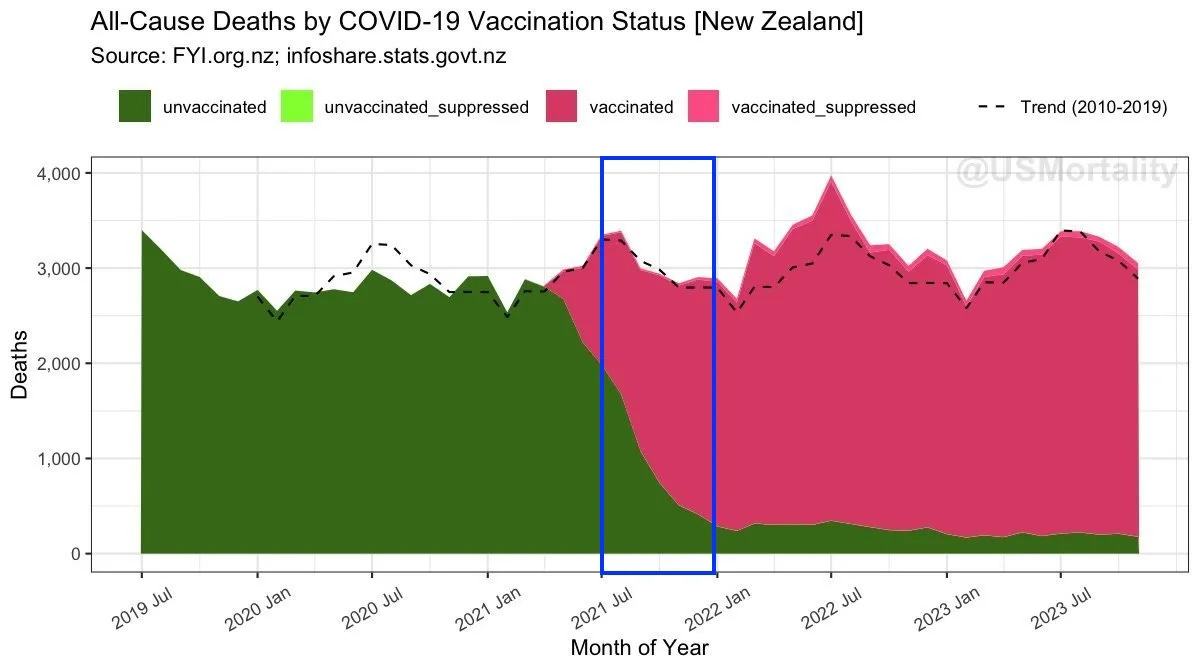
This plot shows a stacked chart of all deaths by vaccination status. The projected trend of 2010-2019 is plotted in black.
Age stratified data shows no significant unusual patterns, except in the 0-20 age group. It appears, that a significant amount of deaths is missing as the total drops from ~90 to less than 30.
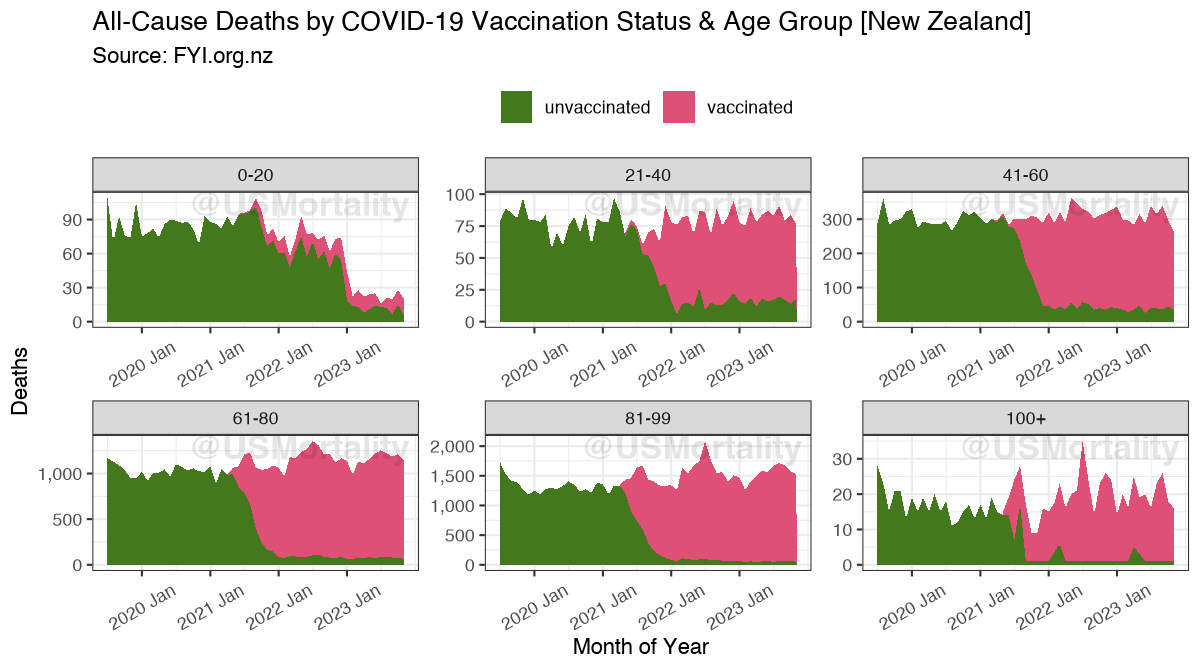
This maybe due to the suppression of 1-4 deaths, as the numbers are relatively small. However, replacing all suppressed values with 4, still suggests, that majority of deaths, at least for 2023 are missing. A possible reason for this could be reporting delay, as younger age groups may be delayed longer.
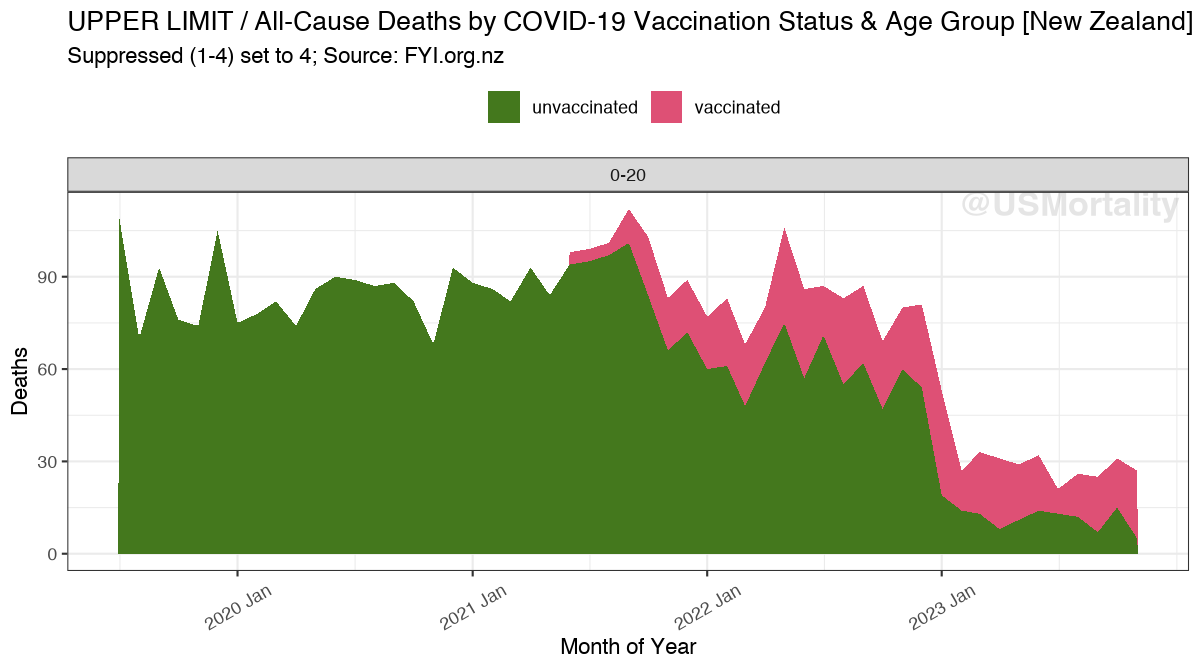
As this age group makes up only 2-3% of all deaths, it should not affect the overall analysis significantly.
Population
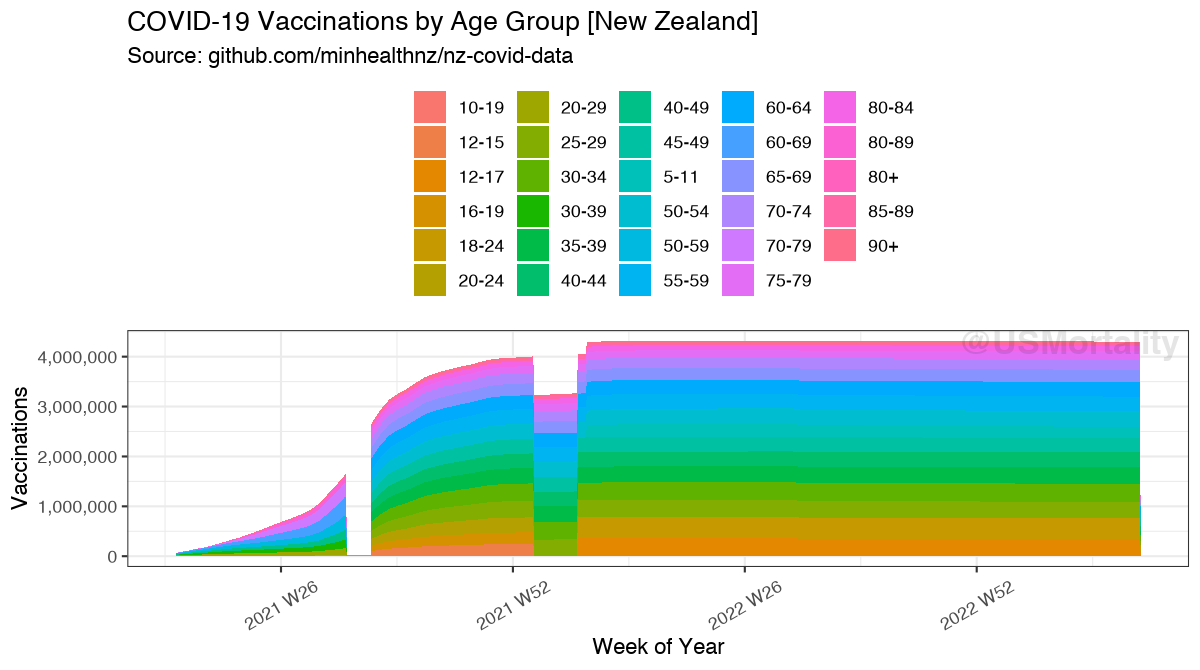
Here’s the raw vaccinated population dataset from the two data sources.
After re-aggregation to target age groups, interpolation & consistency adjustments, this is what the vaccinated population plot looks like:
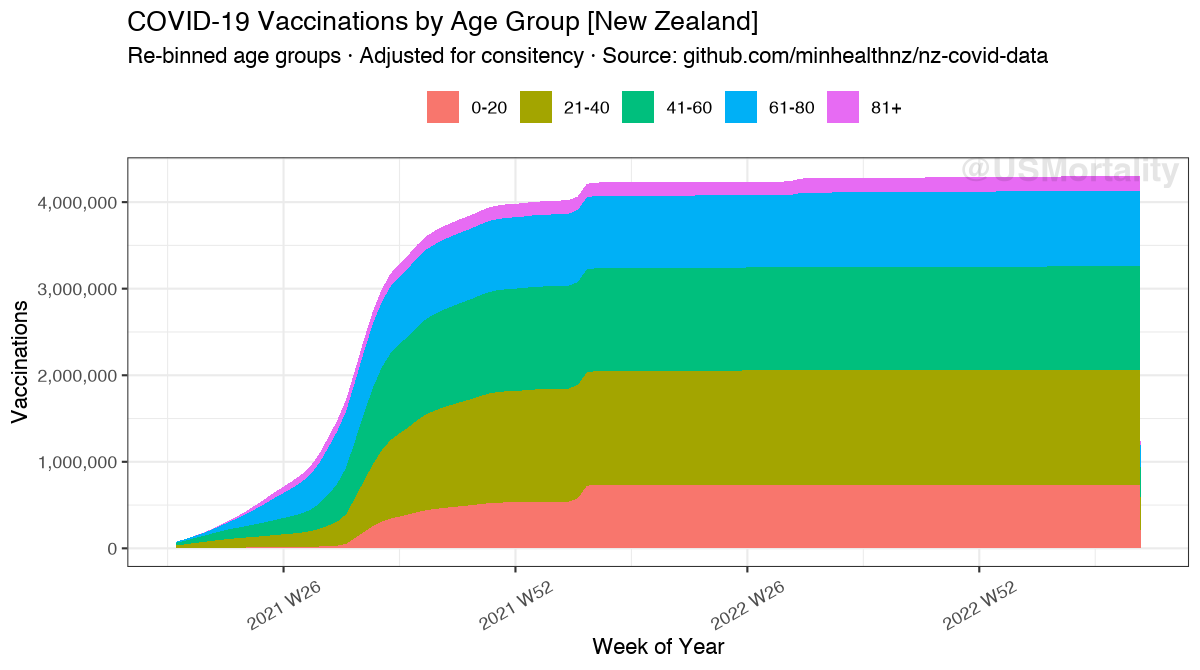
The visible jump in early 2022 is due to the authorization and following ramp-up of <12 ages.
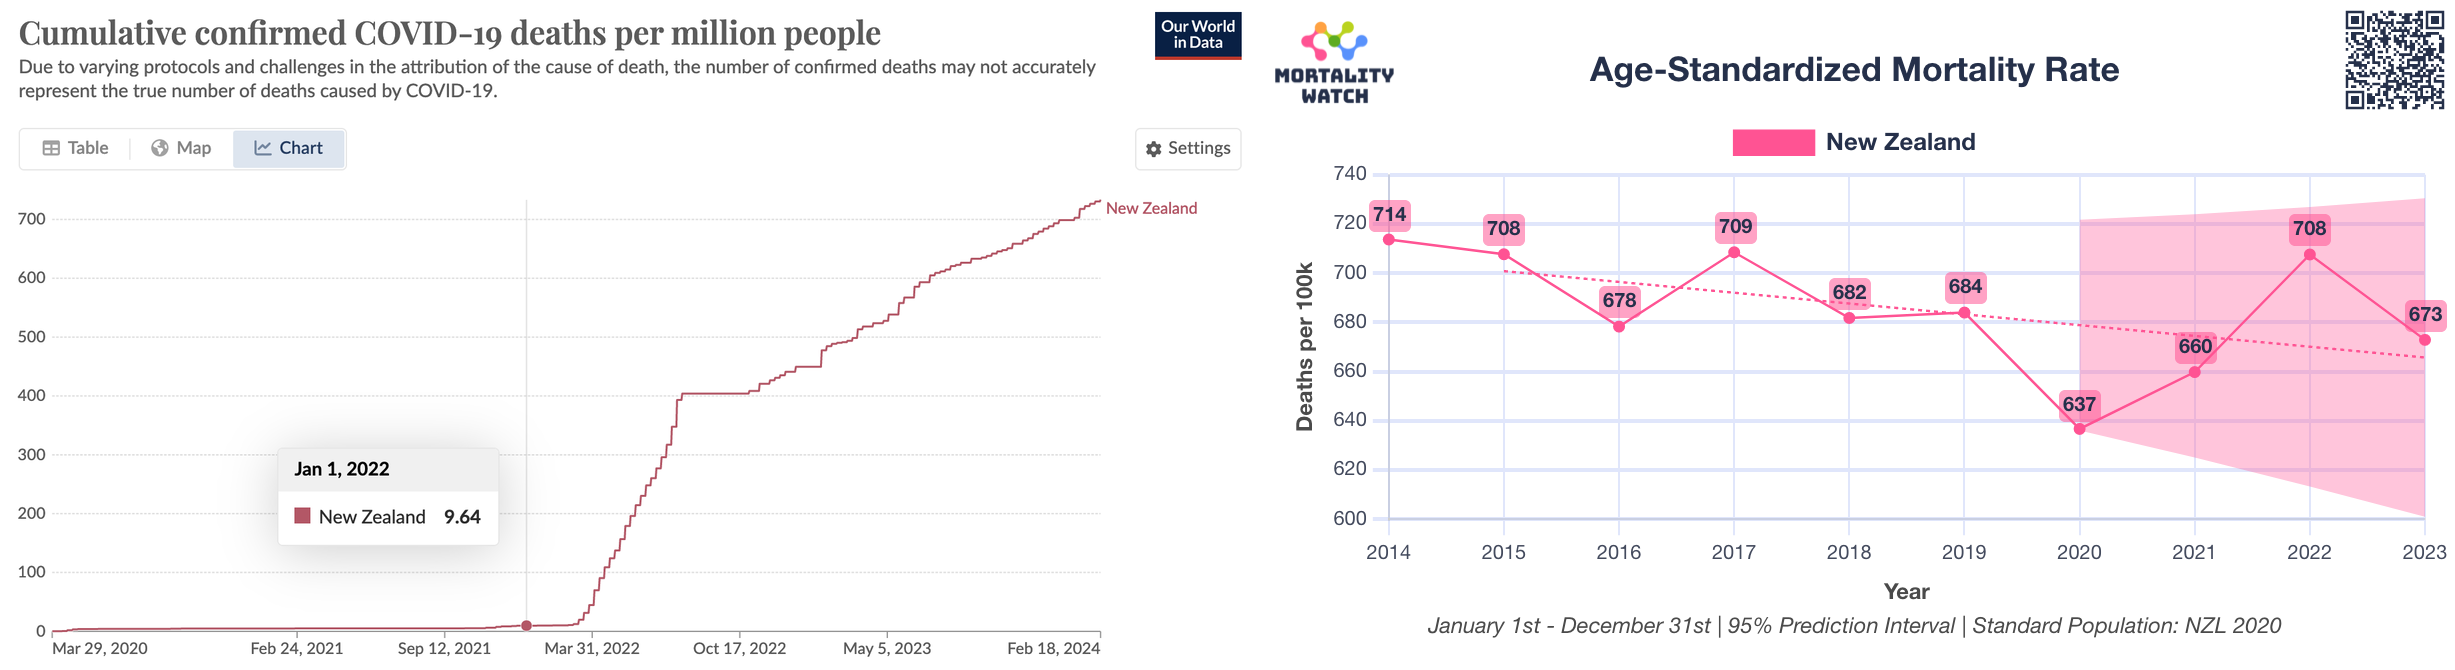
A comparison to total vaccinations, as reported by OWID, reveals an identical picture.
Mortality
Before looking at age-stratified mortality, it’s important to remember, that New Zealand saw essentially no COVID attributed deaths, and no excess mortality before 2022!
Crude mortality by age group & vaccination status reveals the following:

0-20: 2% of total deaths; unreliable, as incomplete; possibly con-founded by health status
21-60: 12% of total deaths; Likely con-founded by health status, as differences can only be observed in overall level, no real peaks or trends are apparent. High Variance due to relatively small denominator.
61-80: 36% of total deaths; Bump in 2021; Starting 2022 no sign. difference visible.
81+ 49% of total deaths; Bump in 2021; Starting 2022 sign. lower mortality levels visible.
Age-Standardized Mortality
Combine age-standardized mortality shows no significant difference, except the large bump in the second half of 2021 for unvaccinated people. However, as shown above, there was neither excess mortality nor COVID-19 attributed mortality before 2022, thus I suspected, that this may be an artifact during the vaccination rollout as first observed by Prof. Fenton in ONS data.
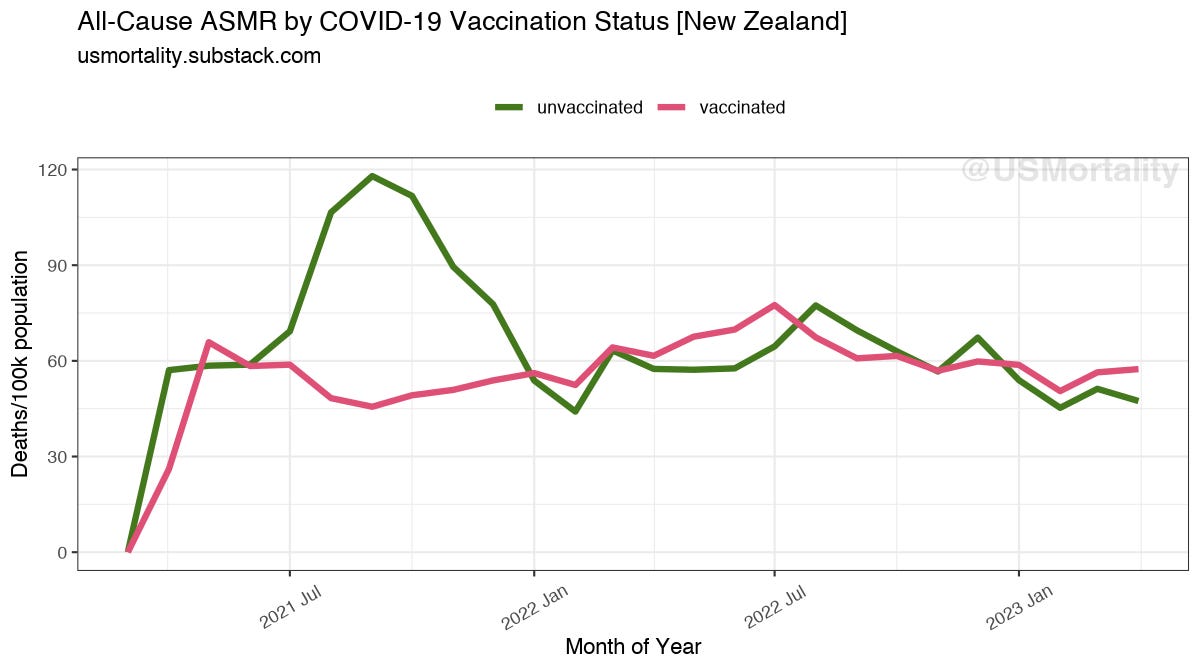
This bump occurred exactly during the time when most people got vaccinated. Thus, it may be possible, that vaccination records were delayed by a few weeks, which then lead to this likely entirely statistical artifact.
To test this hypothesis, I have offset the population data by -4, -2, -1 and +1, +2 & +4 weeks. Here’s the result:
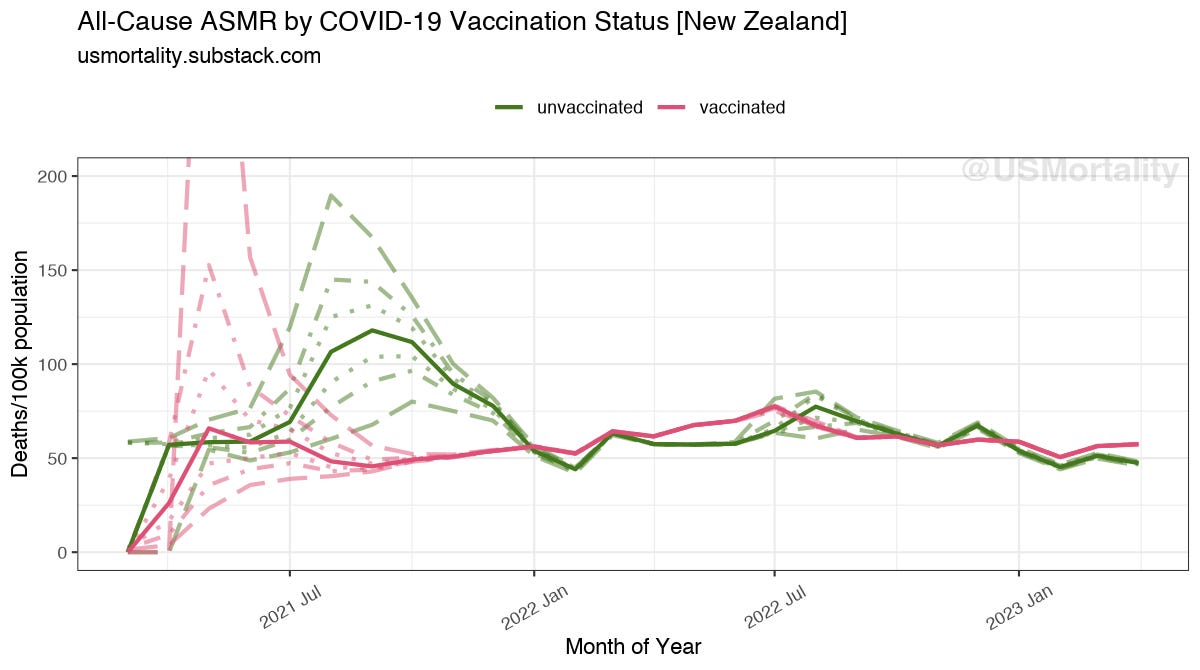
The lowest unvaccinated line which corrects for possible +4 weeks vaccination status delay already shows comparable mortality levels as in the actual 2022 July peak, thus confirming that this effect likely plays a role here.
You also notice, that as the green line goes down, the red line increases, signaling possible vaccine harm or simply also a statistical effect, as frail people might have been prioritized.
The bottom line is that pre-2022 data can be omitted anyway, because no excess mortality and especially no covid mortality was happening in New Zealand anyway.
Thus, only looking at 2022+, overall we can see very comparable mortality levels.
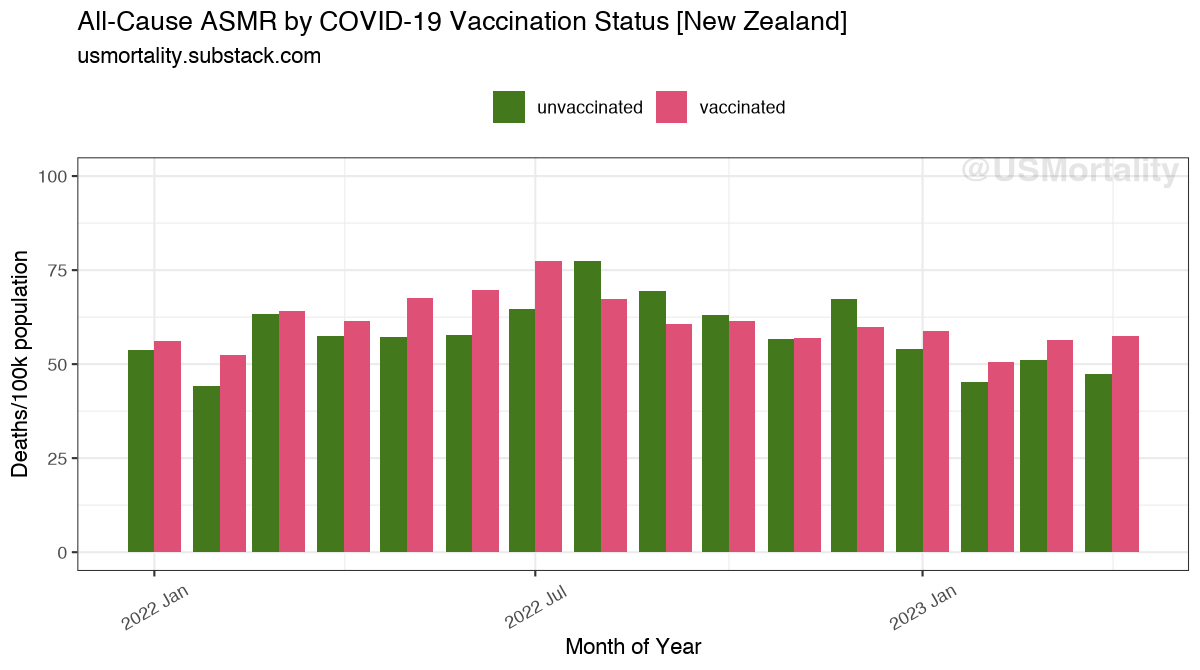
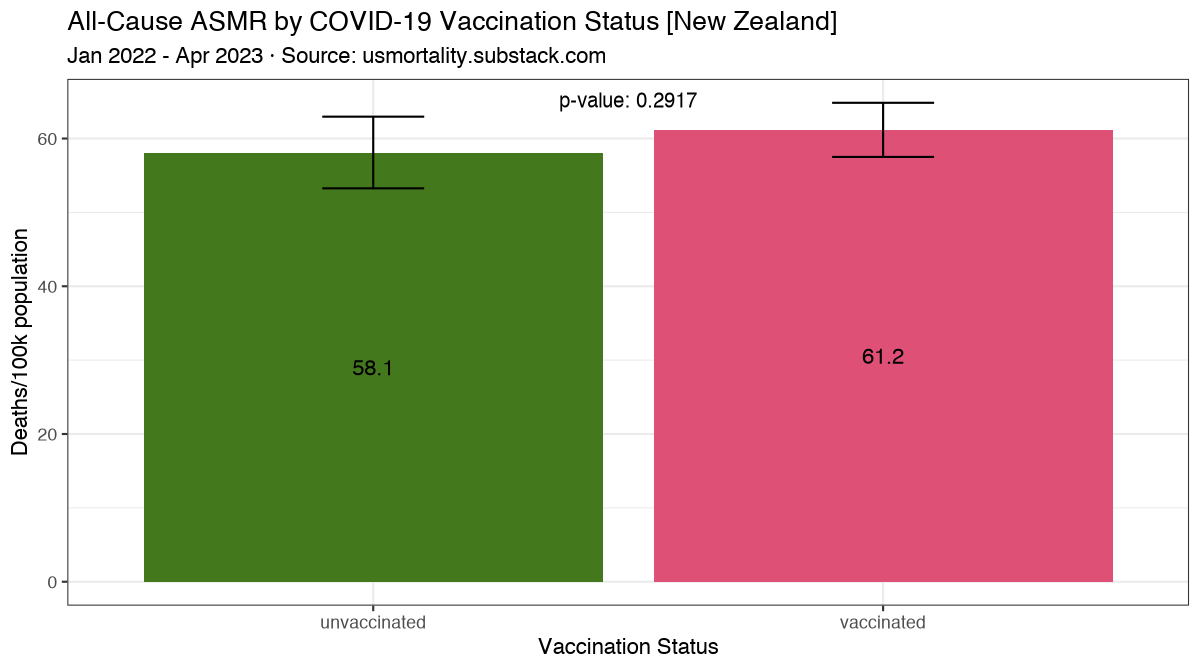
However, during the months with high excess mortality in March 2022-July 2022 and December & January 2023, vaccinated had a higher mortality during 6 of 8 of these months than their unvaccinated peers.

When comparing the mean mortality levels in 2022+, vaccinated have a 3.1/100k higher ASMR than unvaccinated people, the significance however is lacking (p=0.29).
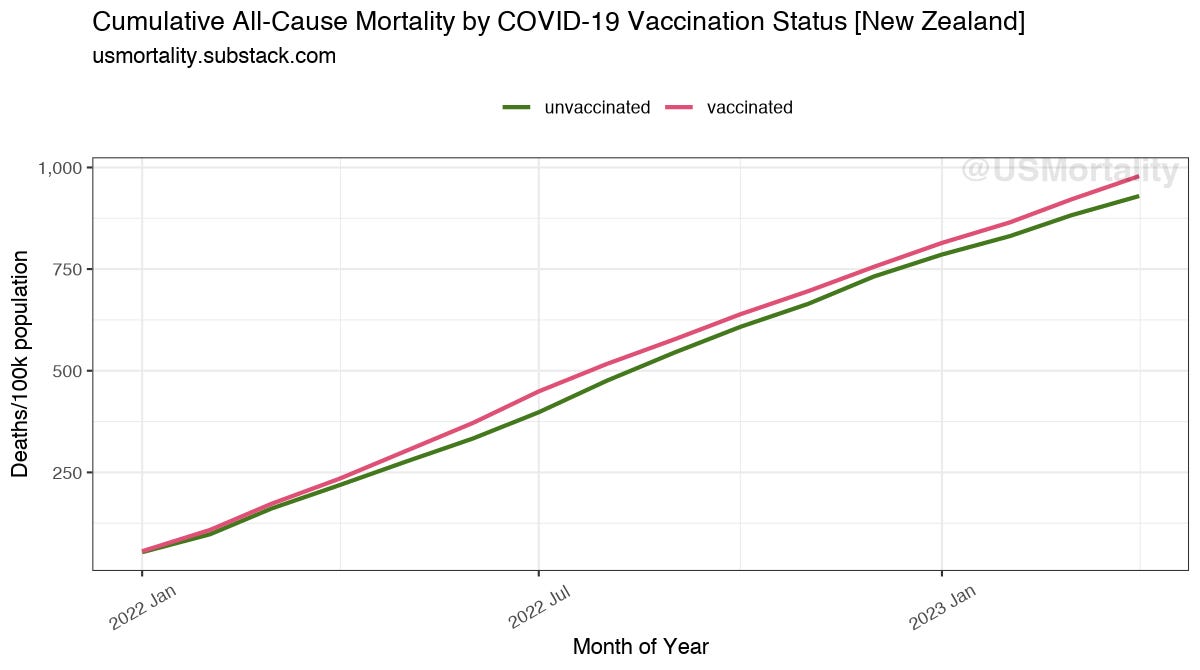
Cumulatively, the vaccinated also remain slightly ahead.

Discussion
The analysis of all-cause mortality by vaccination status reveals no significant difference, thus confirming findings of Benn et al. 2022, that COVID-19 vaccination does not lead to lower all-cause mortality.
Any apparently observed differences can be clearly attributed to healthee vaccinee effect, difference in underlying health status and statistical effects during the initial vaccine rollout.
Older age groups (61+), that account for the vast majority of deaths (85%), clearly did not see any mortality benefit from vaccination.
This was confirmed, during the time New Zealand saw any sign. excess mortality from March 2022 to May 2022, where unvaccinated, consistently had a higher age standardized mortality rate.
Without evidence of effectiveness, the absence of efficacy implies potential harm, regardless of whether it is proven. It is a given that any intervention carries risks. The known substantial harm, including the risk of death associated with these products, leads us into unexplored ethical and legal territory.
WHO defines a 50% efficacy target as threshold for licensure. Clearly this has not been met for real world all-cause clinical outcomes. Claims of high vaccine efficacy have ever been shown against irrelevant & not validated laboratory confirmed endpoints instead of real world clinical all-cause endpoints. As the PCR test has never been validated clinically, it all comes back to this original problem.
Critics may say that the MoH Health System User (HSU) population should be used, which may have smaller total populations per age groups, and would thus lead to possibly higher mortality rates for unvaccinated. Yet, as shown, not only the absolute levels are important, but also the patterns during outbreaks. After all, whether people die (with covid or not; with vaccination or not) is independent of them being a Health system user. In the end, all deaths are reported to the NZSO, and thus the total population of NZSO should be used.
Sources & Calculations
All Source Code is provided here:
Created datasets are provided here: