Further analysis of data from Berkeley Earth clearly indicates that climate change in the period 1860 to 2020 is driven by the sun
Further analysis of data from Berkeley Earth clearly indicates that climate change in the period 1860 to 2020 is driven by the sun
In a recent analysis of global temperature data from Berkeley Earth (1), I found that the main factor driving the temperature increase from 1860 to 2020 is the earth's orientation to the sun. Despite criticism from those who believe in anthropogenic climate change, accusing me of being sponsored by the oil industry and lacking “climate science” qualifications, I responded politely. I also made a mental note that industry sponsorship could supplement my pension. Critics did not engage with the data or provide a compelling argument. I questioned what qualifications are needed to conduct basic data analysis in Excel. A more relevant question is why this type of analysis hasn't been published already. Critics argued that Milankovitch cycles operate on longer timescales and cannot explain current climate change. While true, the specific timing within the solar cycles could be crucial, and the existence of unidentified shorter cycles is possible. I also overlooked the 11-year solar cycles that influence short-term changes in the sun's activity. If these cycles influence climate change, they could help identify a solar signal within temperature records.
Further reading revealed that there is strong evidence that the 11-year solar cycles do impact our climate (2). To maximise the ability to detect this solar signal in temperature data, we require a climate change-sensitive region, high-resolution monthly data, a specific time of year, and a relevant cycle period that aligns with the phase. Previous analysis showed that the northern hemisphere warms faster than southern latitudes, with winter having a more significant impact than summer. For example, the warming rate in January in Greenland from 1860 to 2020 is 6.5 times greater than in July. On this basis I conducted a specific analysis on the January temperature anomaly record in Greenland to identify any potential solar signature.
The first plot just appeared a random set of data points but then I started using a moving average to smooth the data to remove noise. This data set appeared quite sensitive to the moving average but on the basis of minimising noise and maximising signal a five year moving average seemed optimal. Here is a graph of that data (Fig 1):
I have also plotted using a secondary axis solar forcing (solar forcing, also known as instantaneous forcing, refers to the impact of solar radiation variations on the Earth's climate system). The 11 year cycles are apparent within both data sets.
The correlation of the pattern of cycling between these two independent data sets is obvious. In addition, the trend and extent of the maximum and minimum is indicative of the influence on temperature of these short term cycles. This phenomenon may be explained by the extensive work of Svensmark et al (2) who provided considerable evidence that solar cycles have had a significant bearing on our climate. He has made a Youtube presentation summarising his work (3). The proposed hypothesis is that cosmic rays from space create nuclei that are a key requirement for cloud formation and that the high periods of solar activity and magnetic field flux shield the earth from these cosmic rays. The influence of clouds on climate change is widely accepted. Consequently, there is a relationship between solar cycles and temperature. This hypothesis is supported by this analysis. The lack of exact temporal correlation between of both data sets (Fig 1) is unknown. The mean cycle time from the Greenland January temperature data is 11.7 years whereas using sunspot data and solar forcing over the same period it is 10.9 years. There appears to be time shifts in the peaks with each month so to try and remove this I have examined the overall data set using all twelve months and that does provide evidence of peaks cycling at 11.0 years.
There is substantial data (4) on the impact of clouds on our climate and satellite measurements have enabled scientists to ascertain a correlation of global cloud cover and temperature.
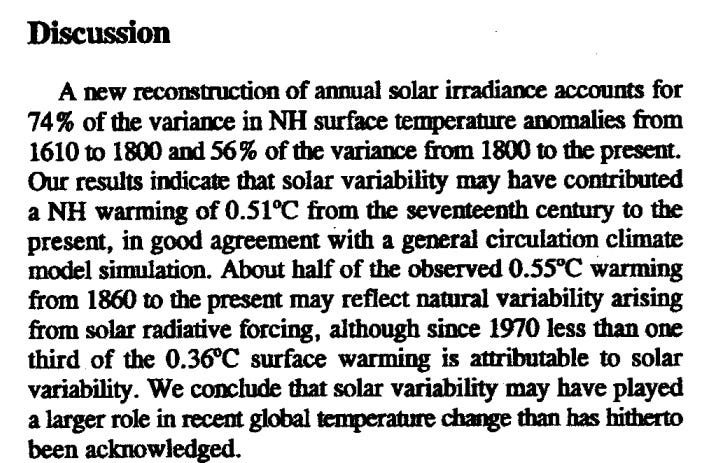
The fact that solar activity is largely responsible for temperature changes in the northern hemisphere during this period has also been highlighted as early as 1995 by Lean et al (5). Dr Judith Lean made estimates of the degrees of contribution of solar activity to temperature. Here is an exert from the discussion section of her paper:
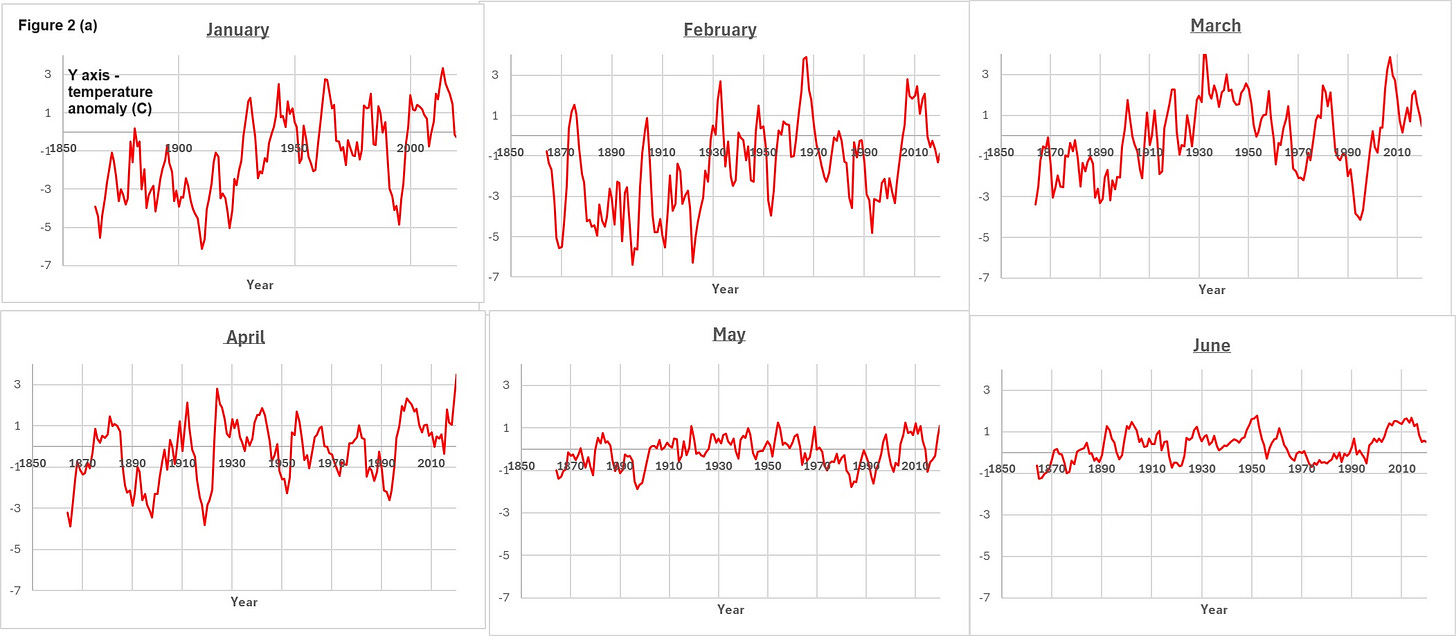
To further demonstrate how dramatic the orientation of the sun to the earth is I have plotted all twelve months for Greenland in a comparable fashion (Fig 2 a & b).
The temporal / seasonal trends and the impact of each month’s contribution to the warming seen in the period 1860 to 2020 are apparent. As concluded in my original analysis the time of year plays a massive role in the warming rate and also the resolution and impact of the 11 year solar cycles. The increased temperature effect in the Northern Hemisphere is probably amplified by higher cosmic ray activity near the poles because of the earth’s magnetic field, in conjunction with the angle at which the winter sun strikes the Earth. Cloud height and the surface temperature also play a significant role.
Summary
This analysis provides further evidence that it is solar activity that is the dominant driver of the climate change seen during the period 1860 to 2020. The “fingerprint”, trend and influence of the 11 year solar cycle activity is obvious (Fig 1) and the monthly temperature anomaly variations (Fig 2 a & b) are clear evidence that the sun’s cycles and orientation are highly influential. My previous article highlighted the temperature changes over the entire period as attributable to the Milankovitch cycles. I had failed to identify that there are other solar cycles, specifically the 11 year cycle. The hypothesis offered by Professor Henrik Svensmark offers a plausible explanation of why these solar cycles are a key component of climate change. Factors that impact short term trends of the earth’s climate are probably far more complex than identified here.
In conducting a literature search on this subject, I came across an article from a NASA climate modeller (6). This article highlighted the various failures to find evidence in the temperature record of the 11 year solar cycles. Consequently, anthropogenic global warming was alive and well. Well, it turns out the solar cycle signal was loud and clear as they were just looking in the wrong way and the wrong place.
The good news for mankind is that the impact of carbon dioxide at the current levels, and therefore the burning of fossil fuels appears to be almost “nett zero”.
Acknowledgements
I have been critical in past articles of the bias nature of the Berkeley Earth web site. However, without them making this data readily available this type of analysis / research would not be possible.
References
(1) Climate Change is Driven by Changes in Orientation of Earth to Sun, Not Carbon Emissions, New Analysis of Berkeley Earth Data Shows
(2) Atmospheric ionization and cloud radiative forcing
(3) Global Warming & Solar Flares · Henrik Svensmark · Astro Physicist · DTU Space · NON-EVENT '22
(4) Climate and clouds
(5) Reconstruction of solar irradiance since 1610: Implications for climate change
(6) The lure of solar forcing
RealClimate: The lure of solar forcing
Data sources:
Berkeley earth
Temperature Country List - Berkeley Earth
NASA
Data.GISS: Forcings in GISS Climate Model: Solar Irradiance (nasa.gov)


