


COVID-19 in the USA
It's a seasonal thing. No impact of vaccination. Nature wins again (and so does science)

In May 2020, Anders Tegnell1, previously universally recognised as one of the most experienced and expert epidemiologists in the world before COVID-mania stripped him of his well-earned credentials, famously said:
it would take about one to two years to know whose strategy had worked best and at what cost to society. He stressed that Sweden’s approach was to look at the “wide public health matter” in which an important consideration was that “people should be able to keep a reasonably normal life”2. […]
“nothing [to do with lockdowns] had a scientific basis”, particularly decisions to close schools, because there was no evidence that children were a major cause of transmission. […]
“It’s a big mistake to sit down and say ‘we should just wait for a vaccine’. It will take much longer than we think. And in the end, we don’t know how good a vaccine it will be. It’s another reason to have a sustainable policy in place.”
Inevitably, like every other expert who has challenged the dogmatic official narrative, Mr Tegnell was unsurprisingly absolutely correct (though still the Branch Covidians try to denigrate him and the Swedish policy).
Mr Tegnell also said that in the end, every country would have around the same amount of cases. Deaths, of course, would also depend on other dominant factors like health demographics, quality of healthcare, and treatments. Perhaps even the vaccine itself?
Almost two years have now past, the vaccine arrived over a year ago and we have all the data to test his hypotheses. Let’s take a look at the USA.
COVID-19 Cases per 100k Population

As we can see in Figure 1, there isn’t much to choose between the US States and Territories in terms of cases per 100k population in spite of very diverse attributes of physical geography, and myriad different non-pharmaceutical interventions (NPIs) designed to mitigate the spread (social distancing, school/business closures, full lockdowns, community mask-wearing, etc.).
One of the most disappointing things about the political treatment of COVID has been the constant denial of nature - natural immunity (innate, cross and adaptive/acquired) and physical geography (climate/seasonality) - that hitherto, like Mr Tegnell, were broadly recognised!
However, even a casual observation of the US map showing cases at various times during the pandemic, clearly reveals distinctly seasonal patterns that vary by region.

As we can see in Figure 2, when the pandemic started, it clearly hit the northeast much more aggressively than everywhere else, regardless of NPIs.

According to Figure 3, it was predominantly the southern states and northwest that experienced their wave of the virus.

In the last quarter before mass vaccinations begin, COVID manifests mainly in the midwest (Figure 4).

In the first quarter of 2021, after mass vaccinations have begun in earnest, it appears that everywhere except the midwest is affected (Figure 5).

The second quarter of 2021 (Figure 6) is the first period that can be compared to the previous year. Evidently, it is concentrated again in the northeast but is more widespread and also, “in spite of” vaccines, more prevalent too.

In the third quarter of 2021 (Figure 7) is again directly comparable with the same period in 2020 and similarly much more prevalent.

It is only in the last quarter of 2021 that COVID cases are finally lower than the previous year in the hard-hit midwest (Figure 8).
We can test these observations statistically by regressing the data on factors that might affect viral spread.
On the one hand we have a simple measure of physical geography, a point coordinate (latitude and longitude) locating each state.
On the other hand, we have the premise that vaccines mitigate spread (since completely debunked in numerous other studies) which could be the only scientific justification for vaccine mandates and passports in society.
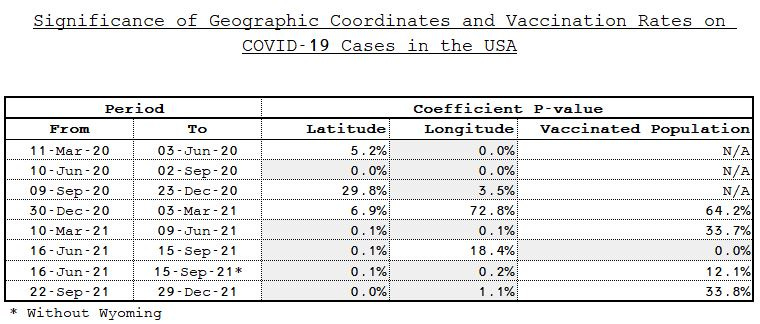
Table 1 summarises the significance of these factors on the cumulative spread of COVID-19 in each of the time periods depicted above. In statistics, a P-value of 5% or less is considered significant.
In the first emergence of the epidemic, longitude is the only significant factor (although latitude is close enough to be considered significant too given the wide geographic distribution of states around their mid coordinate). This is consistent with COVID being concentrated in the northeast and in spite of those blue states having some of the most draconian NPIs.
In the second period, physical geography plays an indisputable part. No matter what your political opinion, especially of stalwart Ron DeSantis who has taken as much flak as Mr Tegnell for daring to take a sensible and balanced approach to dealing with the pandemic in Florida, there is no getting away from the fact that you can’t change geography no more than you can change science simply by saying so.
In the third period when COVID was concentrated in the midwest, this observation is once again supported statistically by the significance of longitude.

In the first quarter after vaccinations, including vaccinated population as a factor (Figure 9) reduces the significance of physical geography but is far from being a significant factor in itself even though rates diverge between 4% and 14% across states.

In the second quarter after vaccinations, actually when very little new vaccinations were given due to growing scepticism of their being “safe and effective” like the state-sponsored propaganda had you believe, the significance of physical geography in determining spread was once again fully restored in spite of vaccination rates varying from 38% to 69% state by state (Figure 10).

Curiously, in the third quarter, it looks like the various different vaccination rates are significant (ousting longitude as a significant factor). However, on closer inspection, it was just Wyoming confounding things and when it is removed physical geography becomes uniquely significant once again despite a vaccination rate range of 46% to 82% (Figure 11).

The pattern is repeated in the final quarter. It’s a full house - physical geography remains a significant factor at every stage of the pandemic, regardless of all other factors.
Vaccination rates, however, are not. Despite ranging between 51% and 94% across different states (Figure 12), their impact on COVID-19 incidence is statistically insignificant.
Excess Deaths per 10k Population
Wherever possible, we try to use all-cause mortality rather than the myopically focused COVID mortality in our analyses. There are two good reasons for this:
COVID attribution is unreliable and subject to bias;
COVID is not the only thing that can kill you. Public health should take into account all other health risks, including the risks of the interventions taken to mitigate them (another thing that went out the window when COVID came along).
Fortunately, the CDC publishes their own estimates of excess deaths3, so I’ve simply used those to analyse the impact of COVID vaccines as a public health measure.
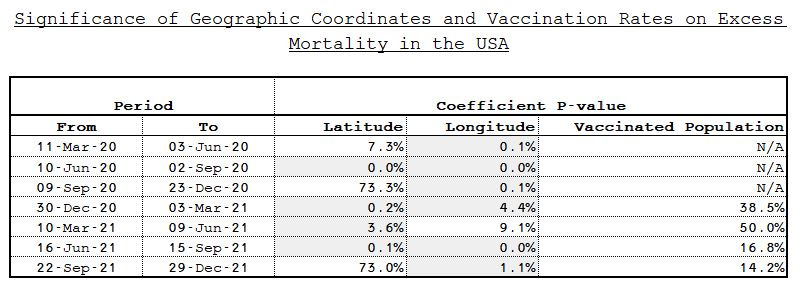
Table 2 summarises the significance of physical geography and COVID vaccination rates on excess deaths by state in each of the time periods depicted above.
Once again, it’s a clean sweep. While COVID-19 is indeed associated with excess death (and this is borne out in the strong relationship between COVID mortality and excess mortality but not within the scope of this article), it inevitably shares the same statistical relationship with physical geography as the virus does.
Once again, there is no statistical significance between different vaccination rates in various states and excess mortality when controlled for physical geography.
Nature wins again. And so does Tegnell and the old science.
Data and Methods
If you want to view all the data analysed in this report (and a lot that wasn’t used) case data analysis can be found here and death data analysis here.
https://en.wikipedia.org/wiki/Anders_Tegnell
https://www.ft.com/content/a2b4c18c-a5e8-4edc-8047-ade4a82a548d
https://data.cdc.gov/NCHS/Excess-Deaths-Associated-with-COVID-19/xkkf-xrst
In 40 years of observing diseases and pests attacking crops and pastures it is nearly always seasonal conditions that drive infection and damage, as they affect crop growth.. this can be a week or two of cold weather, or hot wet weather... but it sets up conditions for either slower growth of the crops, making it more susceptible or conditions that promote rapid growth of the pest.... what is most significant though is when two or three stresses coincide at one point in time- where one stress causes 10% loss on its own, bring two into play at the same time, you get 50% loss but add another all at the same time then you get 90% loss wipeouts... the seasonal nature of covid fits this perfectly as do the co morbidity effects....if the vaccines were to be effective they would need to be protective in those seasonal conditions, blanket vaccination outside those periods of season stress is fruitless when so called immunity wanes so quickly ... however what’s more important is 80% of the population does not get sick in any one year so vaccinating over the 20% of susceptible people cannot have any real impact... that’s just simple maths... mandates are manipulating people for fruitless damaging effect... they know that, we know that...
Long may nature last.
A brilliant collection of data Joel which I have sent straight to my sister, In the USA, who obtains most of her covid info and data from CNN. When speaking to her on FaceTime, she often shakes her head and says “I don’t know where you get your Information”. To which I usually reply, “well it isn’t from CNN or MSM outlets. I gave up on those nearly 18 months ago”. Now at every opportunity I send her and the other sheeple I know data and articles such as yours, in the hope they will wake up.💕💕