


COVID vaccines kill more people than they save.
More statistical proof from the empirical data across Europe.

Inspired by an article written by a research scientist at Columbia University in America1, I said I would have a go at reproducing the analysis using my own data.
I will write it properly when I have time but suffice to say, I do get the same results when looking at all European countries with age-stratified data on deaths from all causes and COVID vaccinations.
I analysed 21 countries - weekly deaths in 65 to 74 year olds vs the rate at which 70 to 79 year olds were vaccinated (VR) since week ending 04-Dec-20. That was the closest single cohort match I could get. I did multiple linear regressions on each dose VR for lags of 0 to -5 weeks and included baseline deaths of smoothed average of years 2015 to 2019.
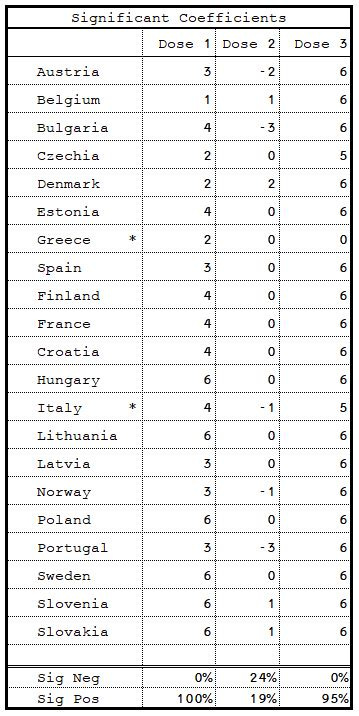
Every single country had at least one lag of dose 1 that was statistically significant (p<0.05).
All but one (Greece, who’s data was incomplete), had at least one lag of dose 3 that was statistically significant and positively correlated with deaths.
Only 24% had a lag with statistically significant negative correlation. Roughly the same number had statistically significant positive correlation.
There was substantial robustness of these results for doses 1 and 3 but lack of consistency for dose 2 when a country showed significant results.
The explanatory power of the model (R square) increased on average from 43% to 92%. In other words, the model accounts for pretty much all of the variability in deaths.
https://www.researchgate.net/publication/355581860_COVID_vaccination_and_age-stratified_all-cause_mortality_risk
See this guy's plot:
https://twitter.com/bcs221b/status/1479072762664792065
He stated in a comment:
https://probabilityandlaw.blogspot.com/2022/01/no-fancy-statistics-simply-plot-of.html?showComment=1641981033008#c3693838699067488985
“If one adds time into consideration, as one should, pondering Covid-19 deaths 14 days later and how the relationship vaccines vs. future deaths evolves, the picture is actually one where it seems that more Covid-19 vaccination actually leads to more Covid-19 deaths.
Just plot time (days), daily vaccination rates, and deaths 14 days later. Then do a surface fit (Linear, for simplicity, or something like a Spline to better "hug" the data points). One finds that deaths decrease with time and actually INCREASE with vaccination.
I posted a graph in response to your tweet.”
Impressive work Joel. Here's hoping all these countries do not push a dose 4 experiment. Seems like 3 is enough for us to reach conclusions.