Empirical Proof of COVID outbreaks caused by mass vaccination
Examination of US States in summer/autumn 2021 shows conclusively that mass administration of the leaky COVID vaccine caused unseasonal outbreaks of the virus that causes COVID.
Yesterday, I shared an observation that COVID appeared to have overcome seasonality in the States in 20211.
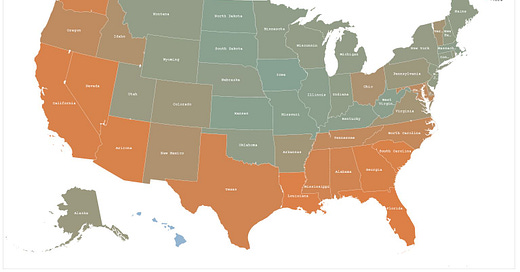
Seasonality can be observed even more distinctly if we map correlations with one state. I have chosen Florida since it is the most distinct state in terms of climate, temperature and UV.
According to the laws of natural geography, the southern and western coastal states all experienced COVID during summer/autumn 2020 (Figure 1). The midwest and northeastern states were negatively correlated, i.e. COVID was on the way out in those regions at that time.
However, the laws of natural geography were perverted in 2021 (Figure 2). Every state south of the Canadian border is positively correlated with Florida during the summer/autumn period. Something more powerful than Mother Nature has conspired to cause COVID to spread uniformly throughout the country regardless of physical geography.
According to Occam’s Razor, I am going to test the hypothesis that the 2021 phenomenon is due to mass vaccination. The scientific rationale is multifaceted. I recommend you review Dr Paul Alexander’s substack2 or el gato malo’s3 for the details but in summary, the COVID vaccine is “leaky”, i.e. it does not neutralise the virus.
This means vaccinated people fail to act as breakers of transmission. In fact, they can actually become super-spreaders because their innate immune system is suppressed so they can harbour higher viral loads in the upper respiratory tract without exhibiting symptoms that might otherwise alert them to distance themselves for the benefit of the rest of society.
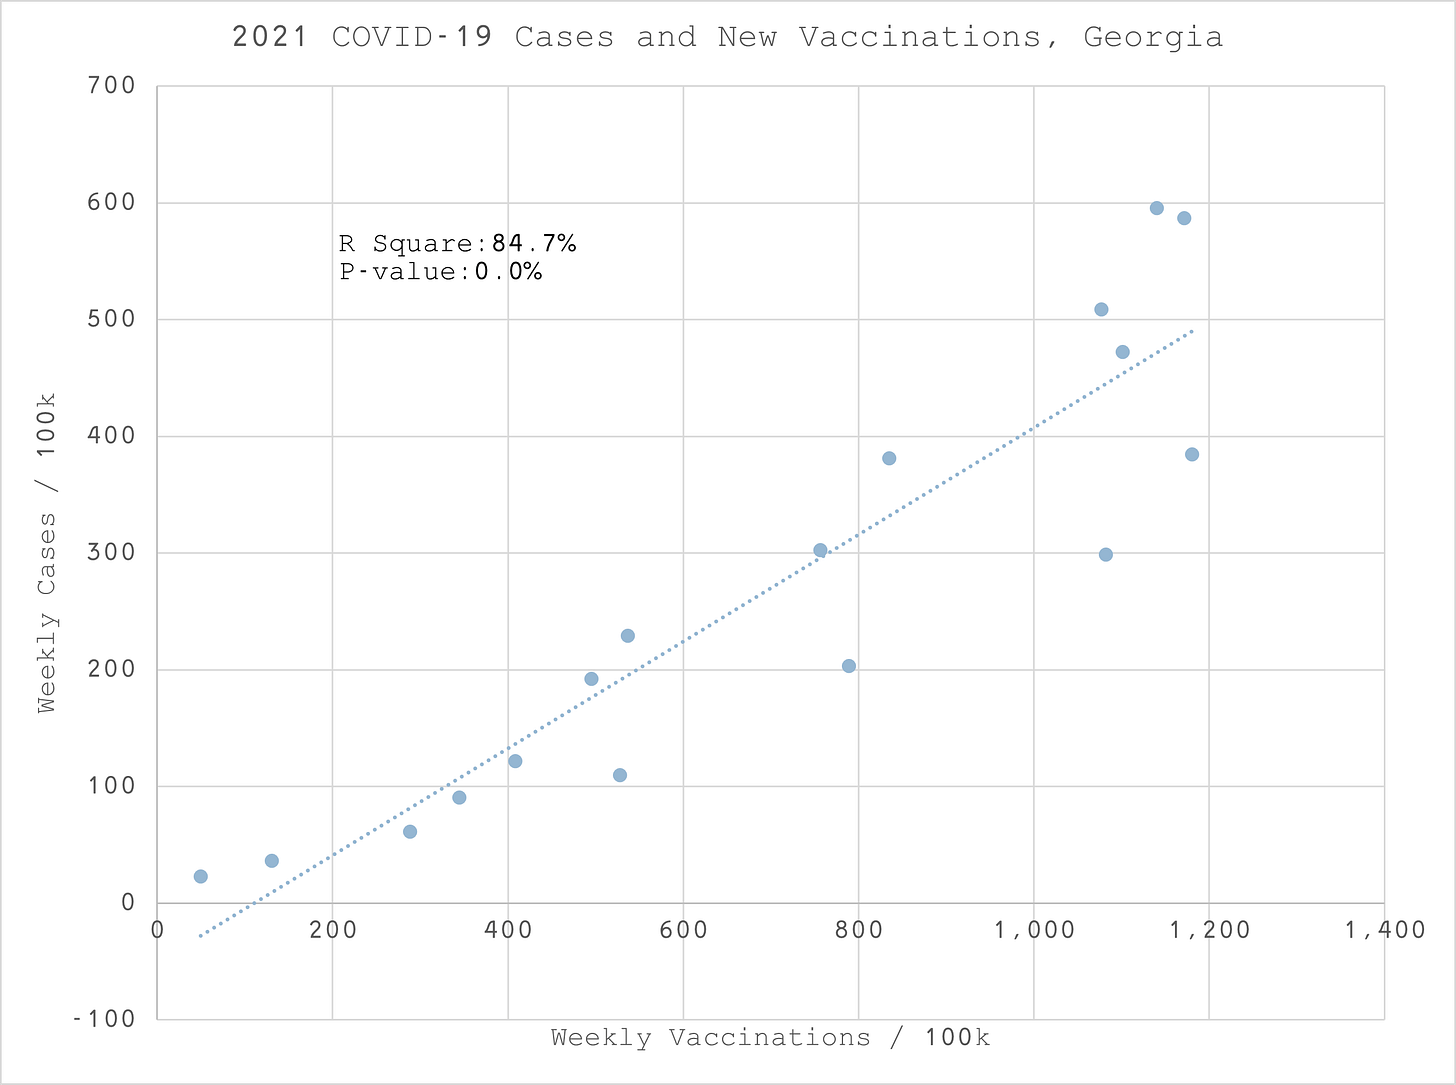
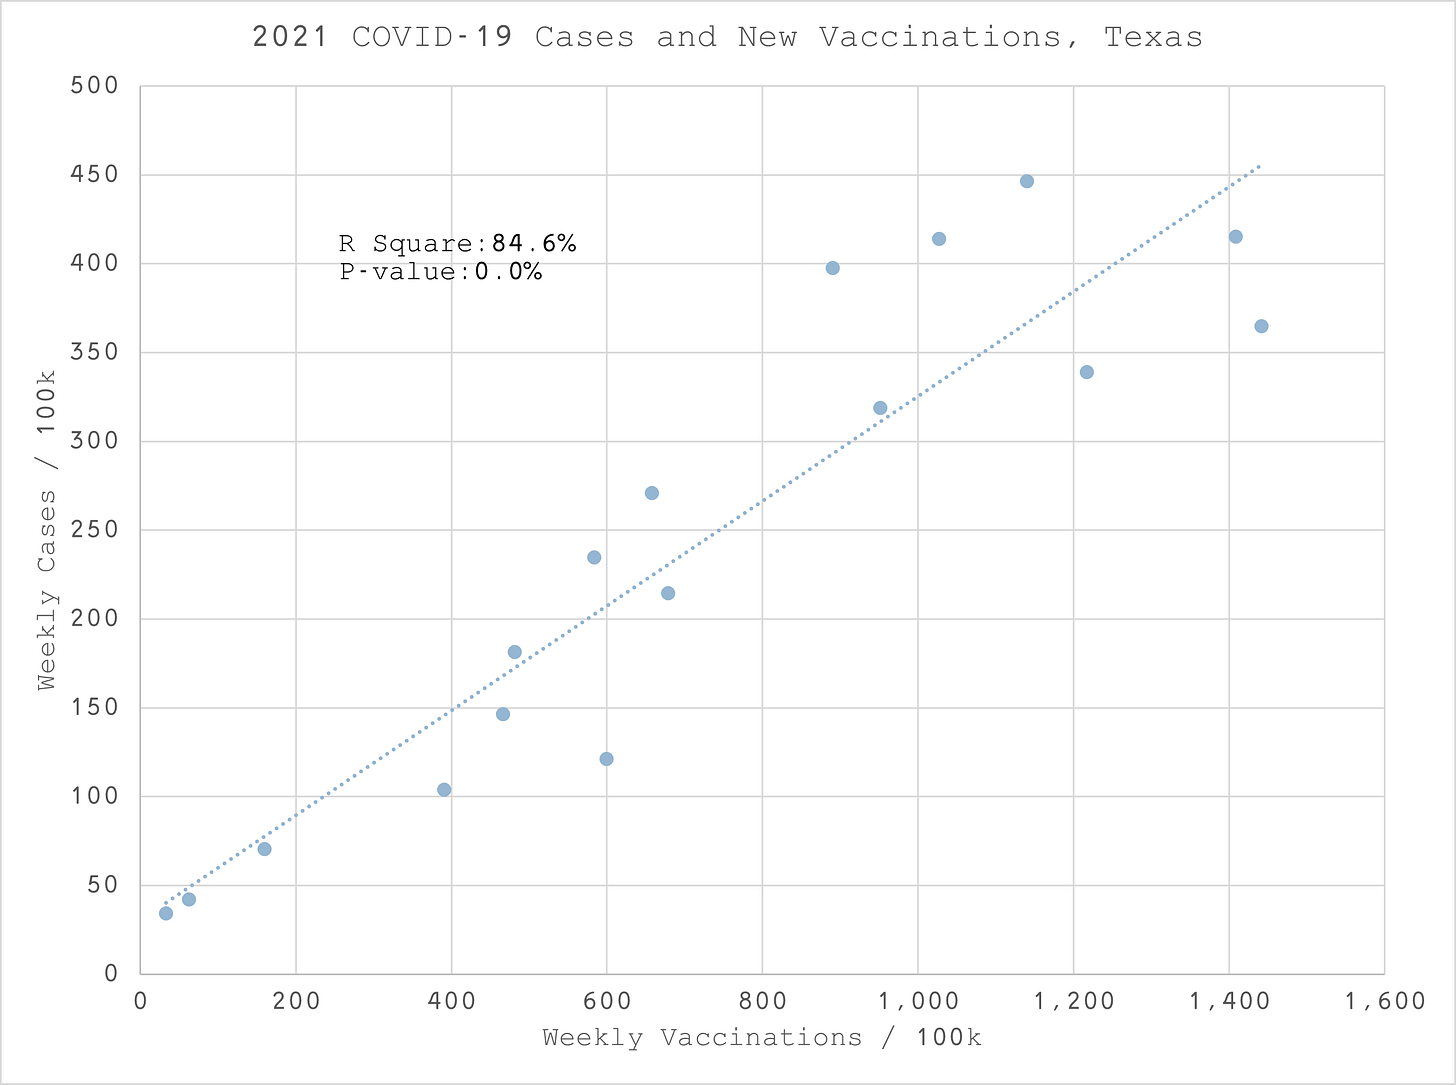
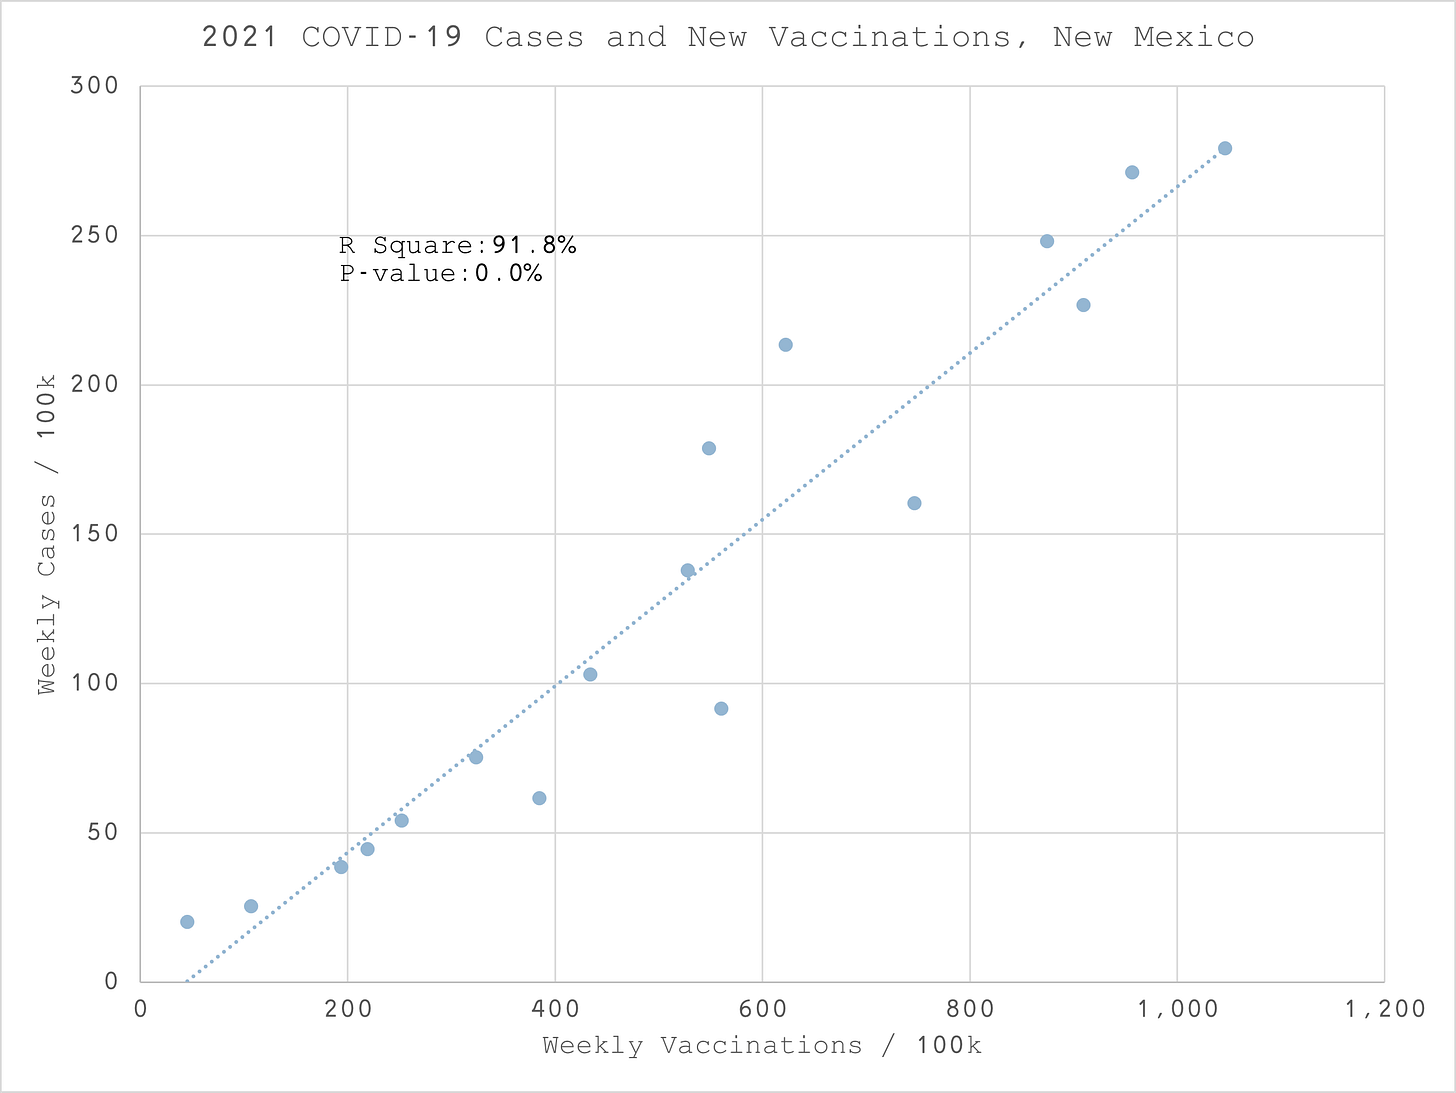
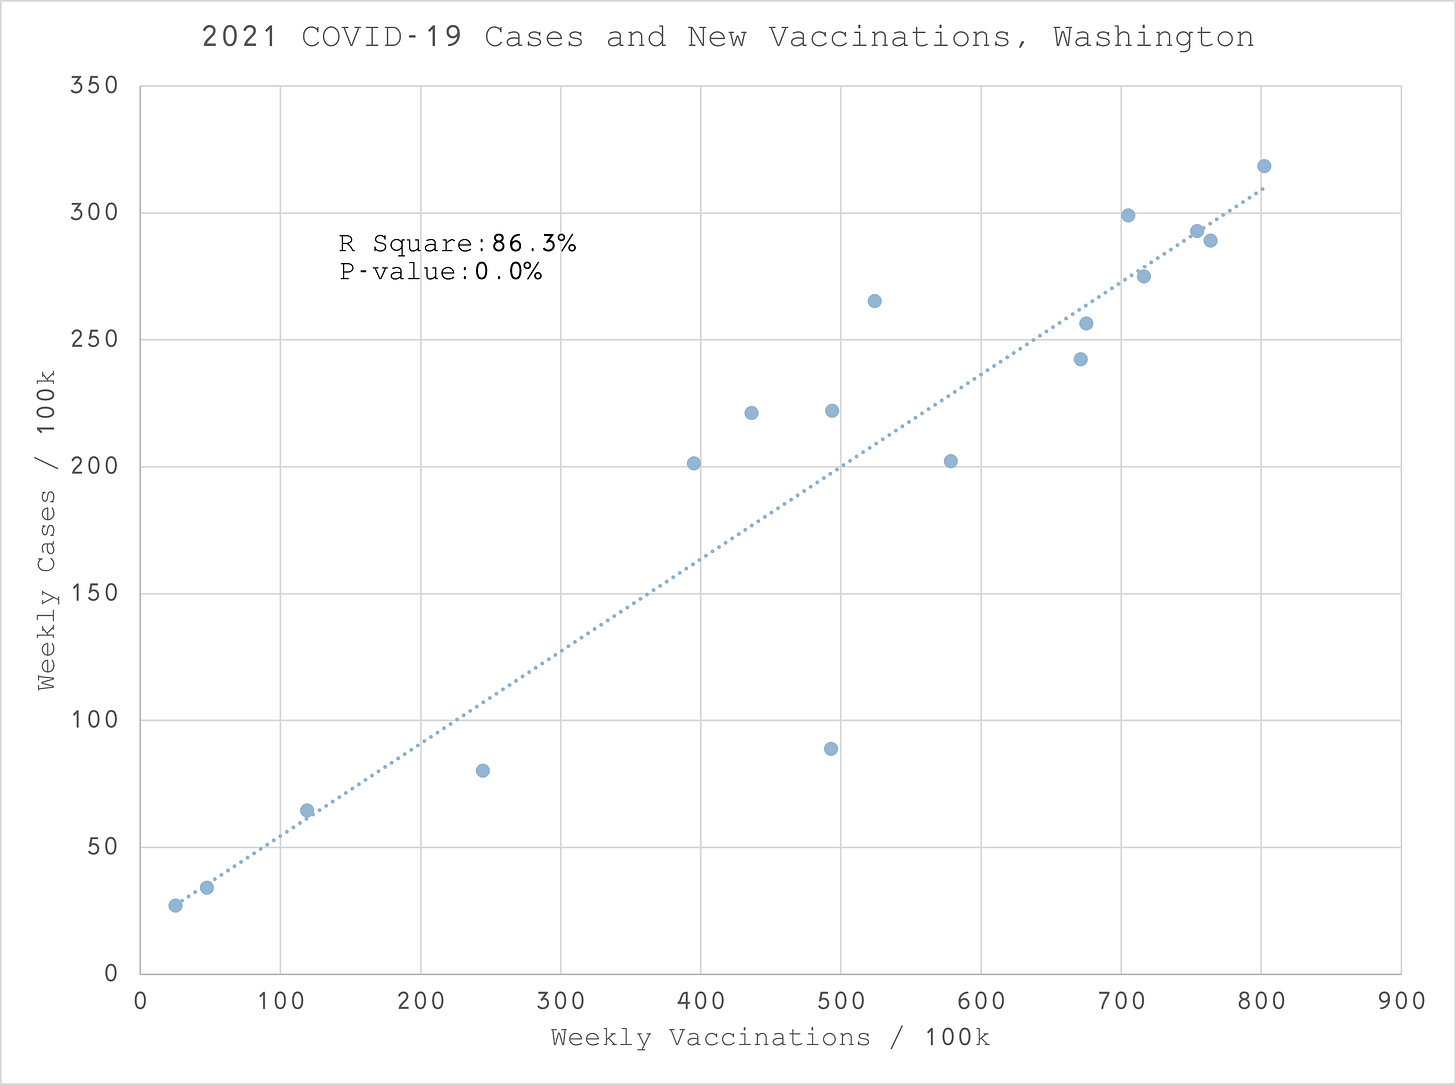
If my hypothesis is correct, we should at least see correlation between vaccinations and cases. We can also test for causation using linear regression.
The R-square value tells us how much of the variation in cases can be explained by vaccination. It ranges for 0% to 100%. Anything over 50% for a single linear regression is pretty decent.
Just as important is the P-value which indicates whether the relationship could simply be due to chance. Typically anything under 5% is considered statistically significant.
Initially, I’ve focused on the southern and western states. The target variable is cases per 100k population. The explanatory variable is vaccinations per 100k lagged by between 1 and 2 weeks. If the primary measures are significant, this lag will also prove causation.
Results
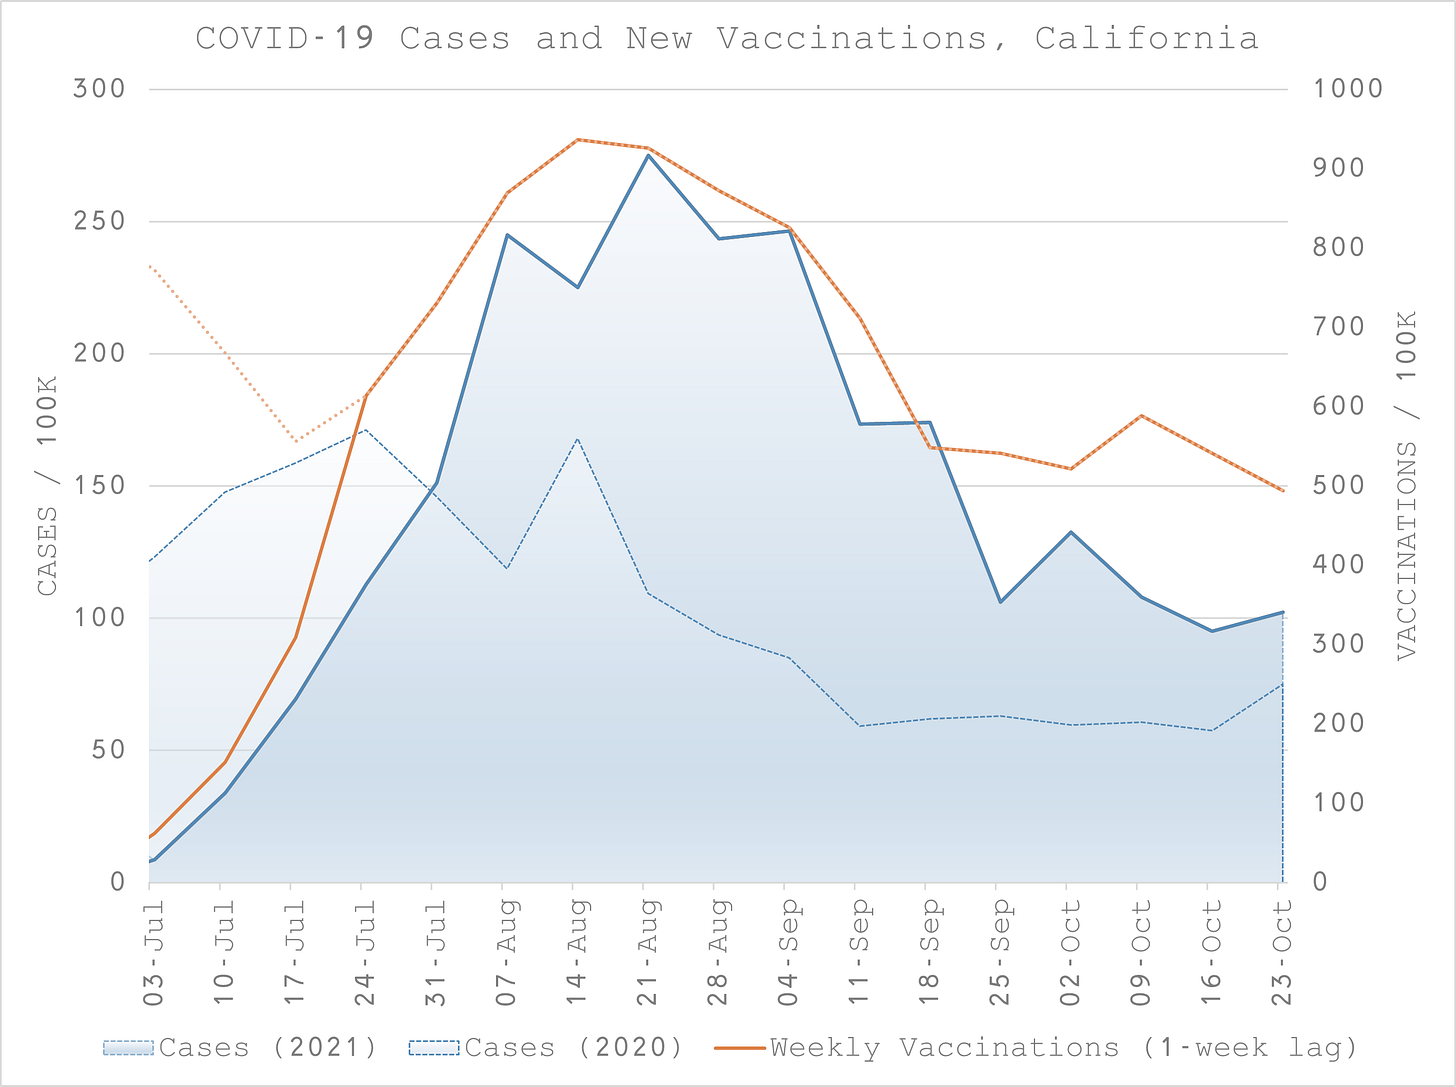
In summary, every single state had an R-square well in excess of 50% and a P-value of 0.0%. Yes, 0.0%, meaning there was no chance that any one of these results was due to chance, let alone all of them.
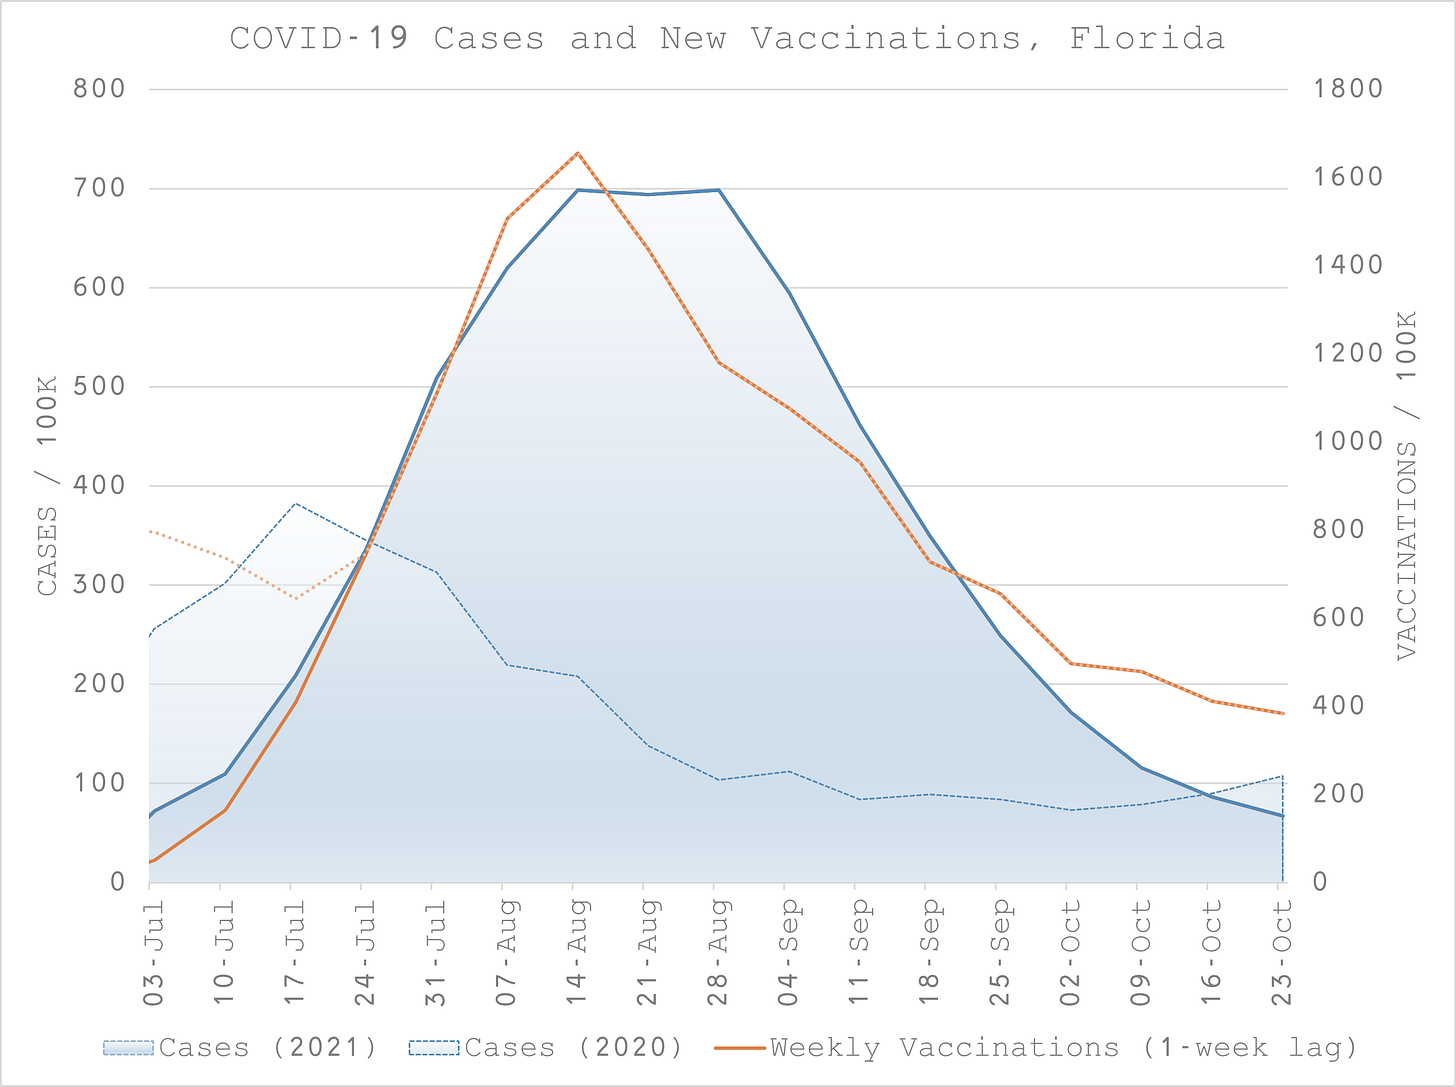
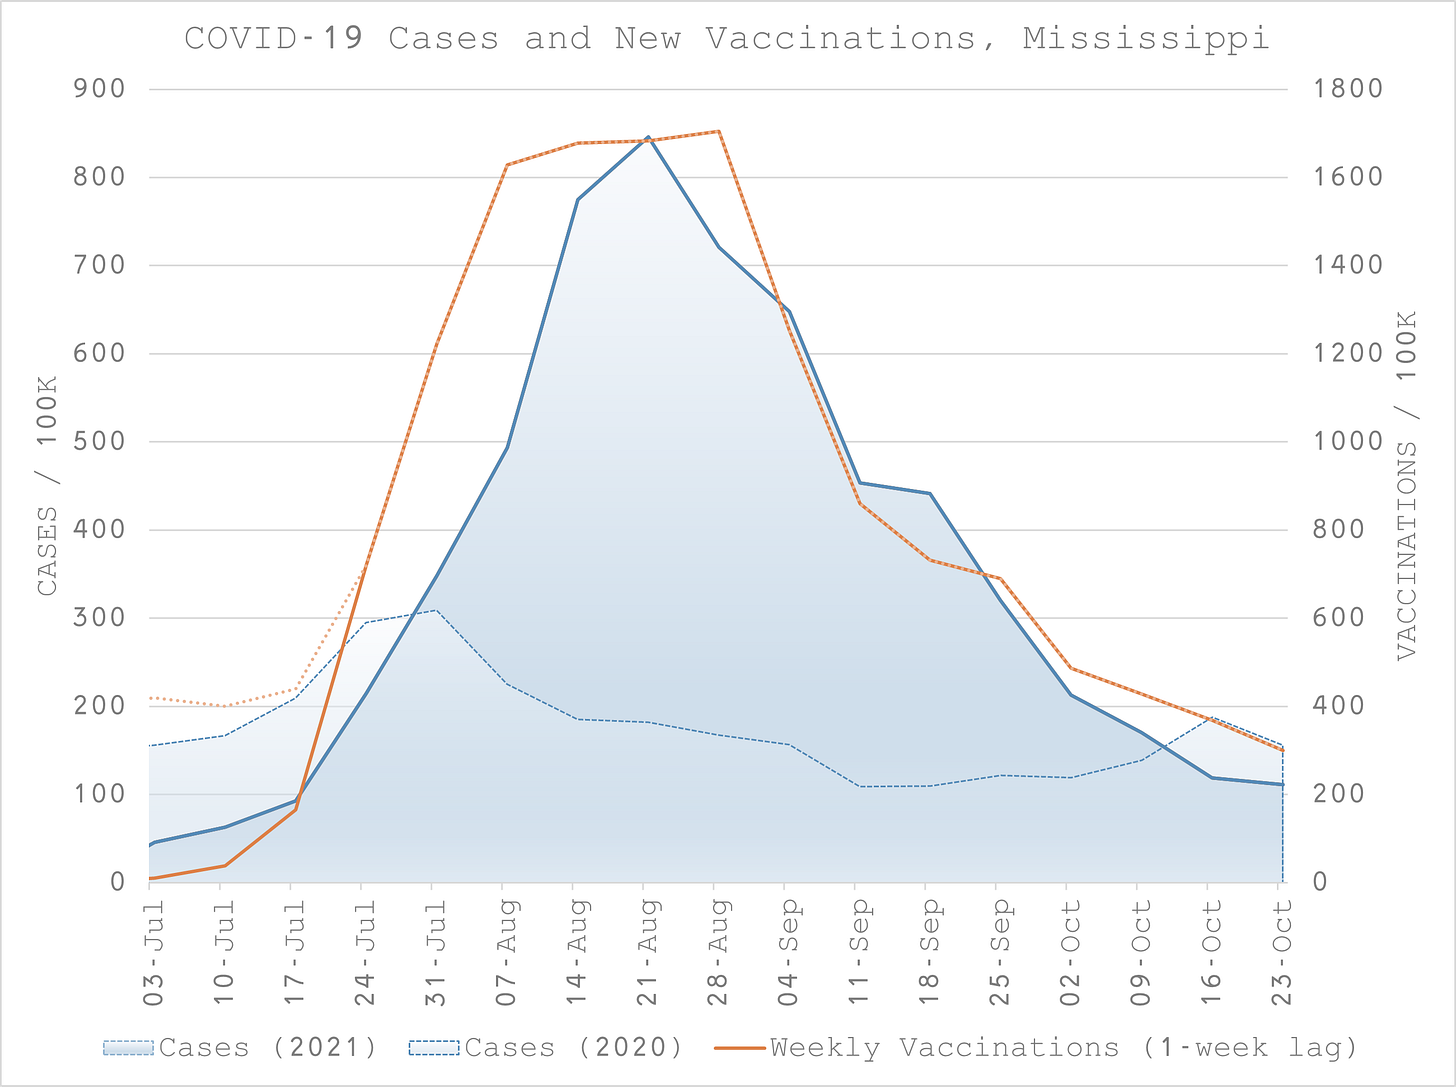
Take a look at the charts and the scatter plots in the Appendix and you will see how this can be.
As a control, I regressed vaccinations on 2020 cases too. And nada. No explanatory power and no statistical significance.
You can see 2020 cases on all the charts, again to be sure with your own eyes. You can see that in 2020 even in these highly correlated states, the exact timing and magnitude still varies, certainly substantially more than 2021.
Talking of magnitude, take a look at the volume of cases too. In 2020, these states reported 2,259 cases per 100k population. In 2021, it was 4,078, an increase of 80%.
So, not only did the vaccine trigger outbreaks, it actually triggered outbreaks that were almost twice the size of the previous year when there was less natural immunity.
The WHO is going to have to redefine “effective” to help Fauci and co. squirm their way out of this one.
Appendix
Southern and Western States COVID Cases and New Vaccinations
Data source: https://data.cdc.gov/
Link to workbook: https://docs.google.com/spreadsheets/d/1G6c43lpwNR-6Tzi_d_OKXYGruvTSbry9/edit?usp=sharing&ouid=108444380134617054259&rtpof=true&sd=true













I won't believe this unless it has been peer reviewed.
Sorry, bad joke, just read a gato malo post.
Great work, love the graphs.
🥰🥰detective Smalley you are amazing. I can only say, thank you. It does not get any clearer. How do we get this information into the heads of the brainwashed. One, maybe two pieces of data at a time. That is all they can take in. I’ve tried.
Today a 70+ y.o. Friend (male) told me he thought the whack job leader, from New Zealand is great. I decided not to even try to dissuade him. MSM has a lot to answer for.