Hospitalisations by COVID-19 vaccination status
Gloucestershire Hospitals NHS Foundation Trust: 06-Sep-20 to 12-Dec-21
1. Main points
For all ages, 18+ years, as COVID-19 admissions rose between 06-Sep-20 and 31-Jan-21, and between 06-Jun-21 and 31-Oct-21, total admissions fell, suggesting COVID-19 was not instrumental on NHS pressure.
The low point of the downward trend in admissions occurs in the week in which COVID-19 mass vaccinations begin, suggesting that the COVID vaccinations potentially triggered the reversal of the downtrend and subsequent rise in admissions.
The rise in weekly admissions is concomitant with the rise in vaccinations and only abates when adult vaccinations also abate.
The weekly variation in admissions for all ages, 18+ years, is more strongly correlated with patients vaccinated prior to admission than unvaccinated patients, both before and after the midpoint of vaccination rates.
It is strongly suggested that COVID-19 vaccinations drive the increase in hospital admissions throughout the period of observation, exceeding hospital bed capacity by 9k beds, roughly 272 beds per week, or 33% of total capacity.
The timing and magnitude of pressure caused by vaccinations varies by age group, health characteristics and vaccination timetable.
None of the age groups shows evidence of a reduction in hospital admissions during periods of COVID prevalence except at the end of the observation period which is just as likely to be the result of a cessation of vaccinations and/or survivorship bias, as it is protection against COVID.
2.Methods
Despite the fact that the government keeps telling us that coronavirus (COVID-19) vaccinations are intended to “save the NHS”, i.e. relieve demand on capacity, and “save lives”, it is challenging to prove this because of the abject lack of analysis and publicly available data on overall hospital admissions and underlying data on deaths by vaccination status, from the ONS and UKHSA.
To overcome this challenge, I have put in over 50 Freedom of Information requests to those organisations and a number of NHS Trusts.
Only one NHS Trust (Gloucestershire) was apparently willing and able to provide me with the information I requested, daily hospital admissions by age with date of first COVID-19 vaccination1.
From this data, I was able to construct weekly timeseries of hospital admissions between 06-Sep-20 and 12-Dec-21, grouped by age ranges and real vaccination status (simply vaccinated or unvaccinated at the time of admission).
I performed a relative trend analysis for each age group and a correlation between the weekly change in total admissions and vaccinated/unvaccinated admissions to estimate if vaccination had an effect on overall hospital admissions.
According to the ONS2:
The vaccination roll-out was also prioritised by health status of individuals, with the extremely clinically vulnerable and those with underlying health conditions being vaccinated earlier than other people in their age group. In addition, frontline health and social care workers, who could have a higher occupational risk, were also prioritised for vaccination.
These factors might influence the analysis which is also potentially affected by changes over time such as in COVID-19 infection levels, different dominant variants, differing levels of immunity from prior infection and seasonality.
That said, in analysing the data across periods where COVID-19 (variants) were prevalent and not, and taking into consideration the other potential confounders, I believe the conclusions drawn from the analysis are reliable and robust.
The analysis demonstrates the impact on hospital admissions during COVID-19 outbreaks, during periods when there is little or no COVID-19, when vaccination rates are low and climbing and when they are high and at a relatively steady state.
Estimating vaccine effectiveness is challenging when vaccination status is not allocated at random, as factors that vary between the vaccination status groups and over time need to be accounted for to determine the causal impact of vaccines on hospital admissions.
Nonetheless, this analysis gives a simple, fast measure of how hospital admission rates vary by vaccination status, and can indicate whether vaccines are likely to be successful in reducing pressure on the NHS.
The vaccination status is binary - either the patient had received at least one dose of a COVID-19 vaccine prior to admission or they had not.
3.Hospital admission rates by vaccination status, all ages over 18 years
The hospital admissions involving coronavirus (COVID) and non-COVID by vaccination status group for all admissions aged 18 years and over, between 20-Dec-20 and 12-Dec-21 (52 weeks) are shown in Table 1.
Of the 58k total admissions, roughly half were vaccinated prior to admission and only 5% of admissions were “with” COVID.
Inevitably, given the very low rate of COVID admissions, it is not possible to analyse the effectiveness of the COVID vaccine directly using this metric. However, if the vaccine was responsible for the very small number of COVID admissions, this should also result in “normal” admission levels at worst (unless, of course, the vaccine itself was responsible for causing non-COVID admissions).
There was no data available on normal admissions but bed occupancy has been consistently between 820 and 890 for this hospital and age group over the years, regardless of the time of year. The admissions are equivalent to around 1,100 each week on average, well in excess of normal occupancy which is also not far off maximum capacity.
Between 20-Dec-20 and 01-Aug-21 (33 weeks), the period when admissions were rising, the expected admissions (as a function of normal bed capacity and an arbitrary 1-week average stay) is 27k (Table 2). The actual number of admissions is 36k, an excess of around 272 per week on average, or 33% of capacity. This represents the number of excess discharges the hospital would have to make each week to maintain bed capacity.
According to Table 3, the average weekly increase in total admissions is almost 9 per week, every week between 27-Dec-20 and 01-Aug-21 (33 weeks) before it plateaus (and eventually recedes again).
This net increase is a function of a 14 admissions decrease in the unvaccinated relative to a 23 admissions increase in the vaccinated.
There are two competing hypotheses to explain the total increase.
The main hypothesis (mine) is that the vaccine (which is known to cause some severe adverse reactions that lead to hospitalisation)3 causes more non-COVID hospitalisations than potential COVID hospitalisations mitigated.
The alternative hypothesis is that the unvaccinated admissions do not decrease at the same rate as the vaccinated admissions increase due to the “unhealthy unvaccinated” effect, i.e. the seriously ill are too ill to be vaccinated or refuse if they are significantly moribund.
Notwithstanding the prescience required by the patient to fit the second hypothesis, this is obviously a stark contradiction to the statement above quoted from the ONS, whereby the critically ill and those with other underlying health conditions are actually prioritised for vaccination.
Nevertheless, we can put these hypotheses to a further test by looking at the correlations between total admissions and admissions by vaccination status.
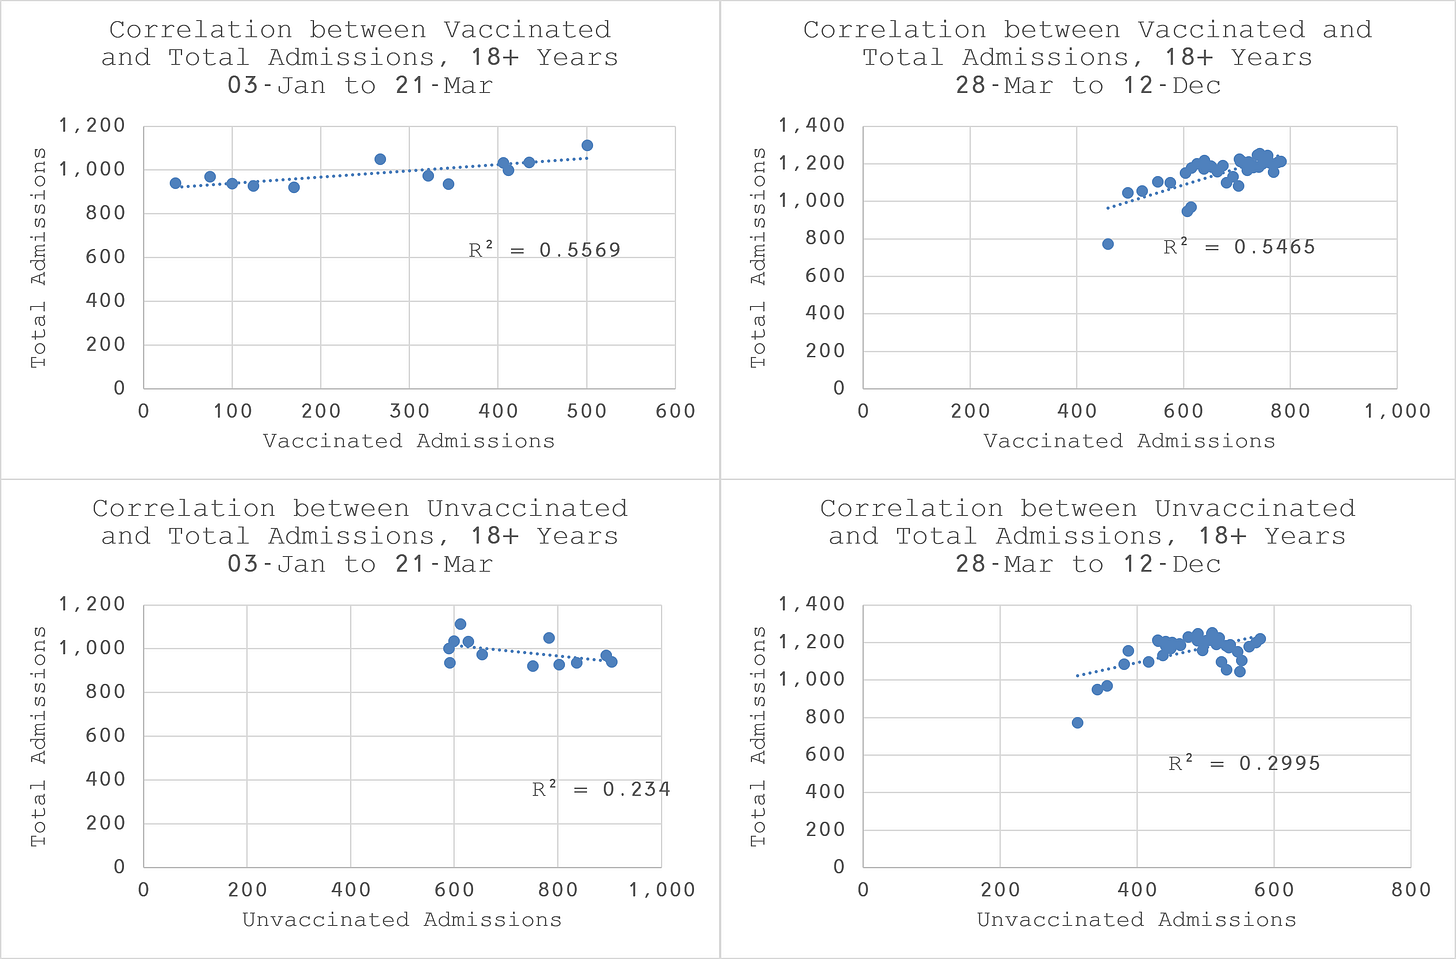
As we can see from Figure 2, the correlations between vaccinated admissions and total admissions are about twice as strong as the correlations between total admissions and unvaccinated admissions for all the over 18s. This demonstrates that vaccinated admissions have a stronger relationship with the weekly variation of all admissions than unvaccinated admissions.
Looking at Figure 3, we can see that up until the end of March the vaccinated admission rate exceeds the population vaccination rate. This is consistent with the ONS statement that the clinically vulnerable are prioritised for vaccination. It appears that this results in an increase in hospital admissions, probably due to the vaccine itself as expected. It is plausible that the sustained increase in hospitalisations beyond March is simply due to a longer delay between vaccination and adverse event requiring hospitalisation in some of the vaccinated patients.
The trend analysis and correlation analysis together strongly suggest that vaccinated admissions are driving total admissions. Since admissions are rising for most of the period under study, it is apparent that COVID vaccinations are responsible for increased admissions, regardless of the incidence of COVID-19, the level of vaccination or the rate of vaccination.
4.Hospital admission rates by vaccination status, ages 18-39 years
Looking at Figure 4, we observe that vaccinated admissions did not start in earnest until 10-Jan-21 for patients aged between 18 and 39 years old. The mid point of vaccinations was on 06-Jun-21 which which is a few weeks after admissions have ceased to rise.
According to Figure 5, the vaccinated admission rate runs slightly below the population vaccination rate until the end of April with a couple of spikes. This might suggest that the clinically vulnerable in this age group were less likely to be hospitalised by the vaccine than all ages over 18 years.
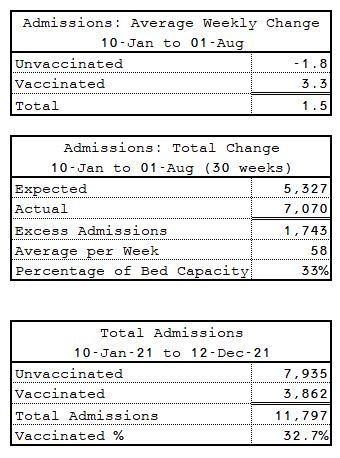
However, overall we observe the same relative impact on total admissions that appears to be driven by the vaccinated patients (Table 4) with an average increase in admissions of 1.5 patients every week, resulting in an excess demand of 33% of normal bed capacity. Overall, only 33% of admissions were in the vaccinated.
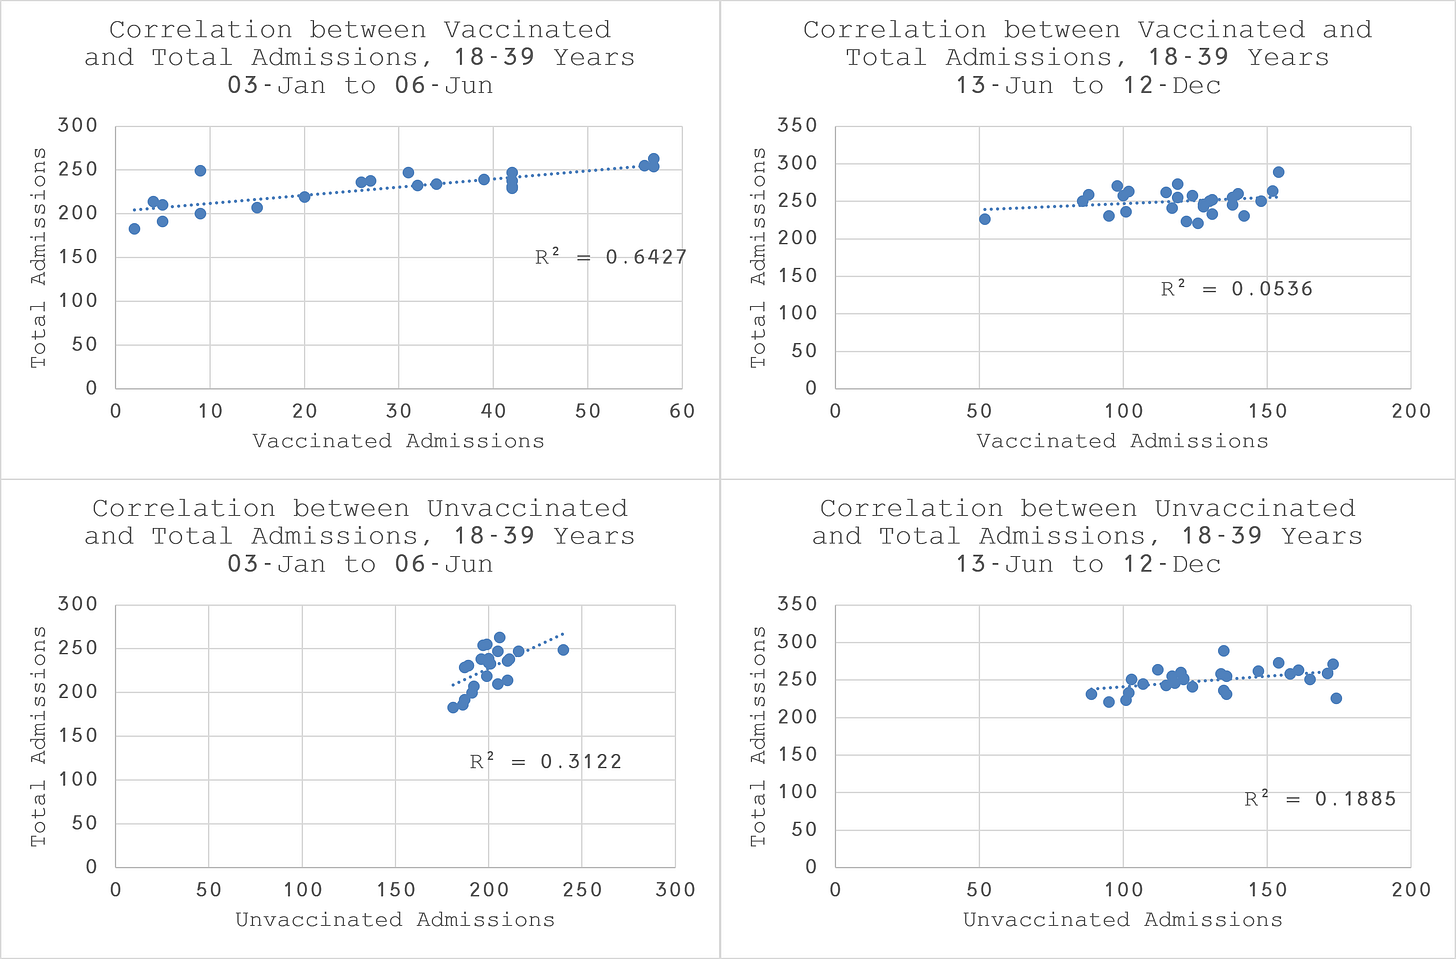
The correlation plots (Figure 6) reveal that the vaccinated admissions are twice as closely related to total admissions than the unvaccinated in the first half of mass vaccination. This would be consistent with the expectation that the clinically vulnerable should be more susceptible to hospitalisation due to adverse reaction to the vaccine.
After the midpoint, the unvaccinated, although not strongly correlated in absolute terms are three to four times more closely correlated than the vaccinated, suggesting that the healthy patients in this age group are no longer affected by the vaccine, as we would expect.
5.Hospital admission rates by vaccination status, ages 40-49 years
Looking at Figure 7, we observe that vaccinated admissions did not start in earnest until 03-Jan-21 for patients aged between 40 and 49 years old. The mid point of vaccinations was on 18-Apr-21.
In contrast to the 18-39 year olds, we see a more significant rise admissions concomitant with the rise in vaccinated admissions.
According to Figure 8, the vaccinated admission rate runs well above the population vaccination rate until the end of April. This is consistent with the concomitant rise in admissions and might suggest that the clinically vulnerable in this age group were unsurprisingly more likely to be hospitalised by the vaccine than the 18-39 year olds.
After April, the admission rate trend is neutral, punctuated by some wild weekly variations which might signify that those being hospitalised may well have been hospitalised soon anyway.
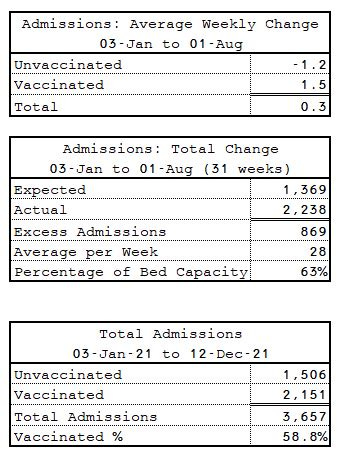
Over the whole period between 03-Jan-21 and 01-Aug-21 (Table 5), there is a very modestly positive average weekly increase in overall admissions.
However, since the age group typically has relatively very few admissions, in percentage terms it actually represents a substantial increase over expectations with an excess demand of 63% of normal bed capacity. Overall, 59% of admissions were in the vaccinated which is higher than the average rate of vaccination in the population over the same period of just 53%.

The correlation plots (Figure 9) confirm the trend analysis and overall statistics. They reveal that the vaccinated admissions are substantially more highly correlated to total admissions than the unvaccinated in the first half of mass vaccination and almost twice has correlated afterwards as well.
It is clear that vaccinated admissions are driving the rise and variation in admissions for this age group in spite of the population not being predominantly vaccinated during the period.
6.Hospital admission rates by vaccination status, ages 50-69 years
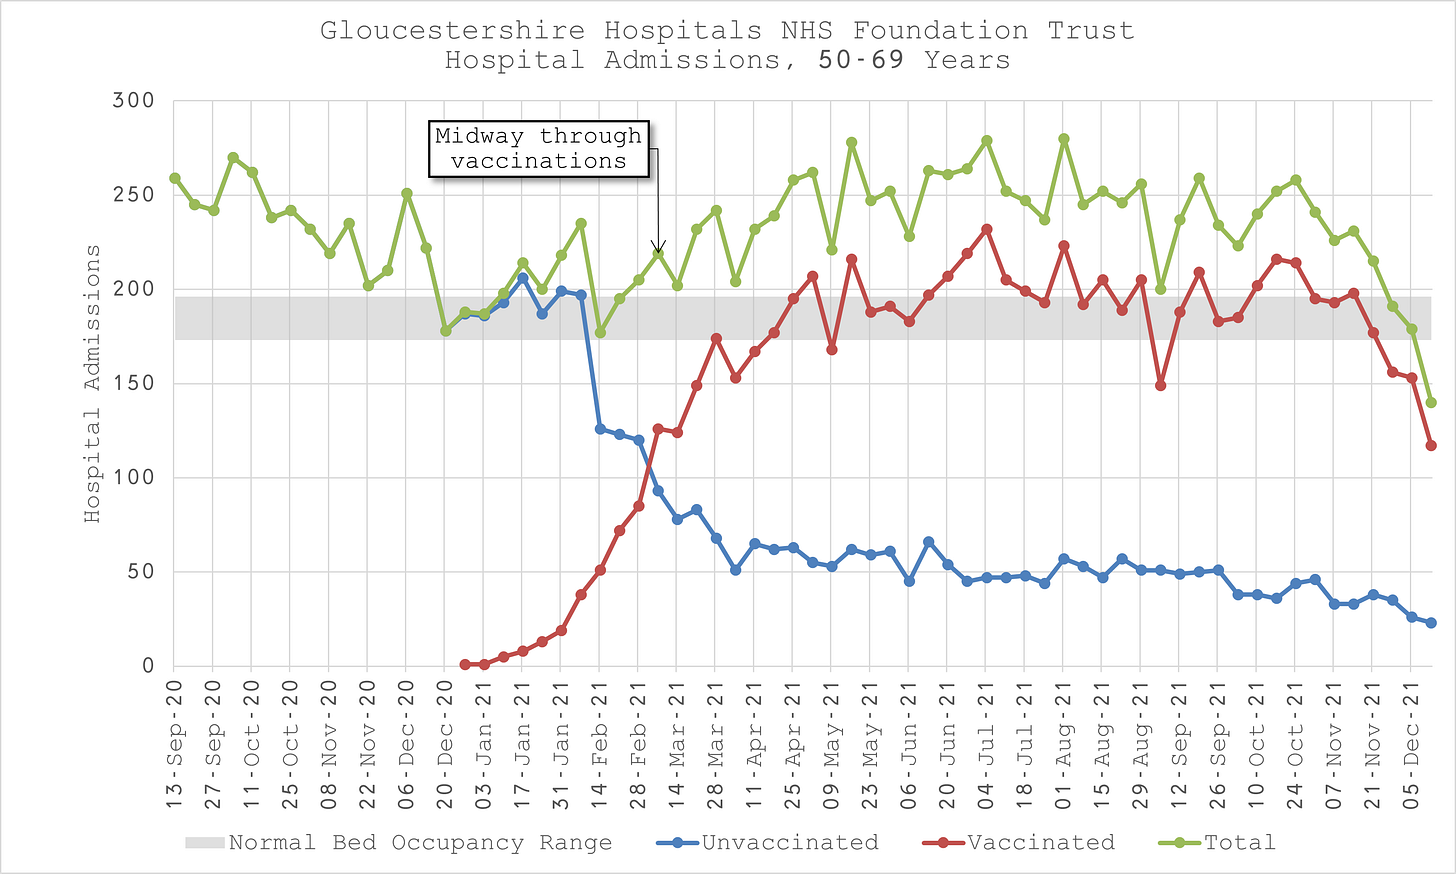
Looking at Figure 10, we observe that vaccinated admissions start in earnest on 03-Jan-21 for patients aged between 50 and 69 years old. The mid point of vaccinations was on 07-Mar-21.
In contrast to the 40-49 year olds, we see a more modest rise in admissions for a few weeks after vaccinations start, followed by a sharp drop even as vaccinations continue, followed again by a more sustained rise through to mid-May.
According to Figure 11, the vaccinated admission rate runs exactly on the vaccinated population rate for the first five weeks. This is probably due to Healthcare workers being prioritised for this age group before the clinically vulnerable.
After Jan, the vaccinated admission rate runs consistently above the population rate until the end of March when over 70% of the population in this age group has been vaccinated.
Similarly to the 40-49 year olds, this is consistent with the concomitant rise in admissions and might suggest that the clinically vulnerable in this age group were unsurprisingly more likely to be hospitalised by the vaccine in the first few weeks after vaccination, followed progressively less by the less and less vulnerable.
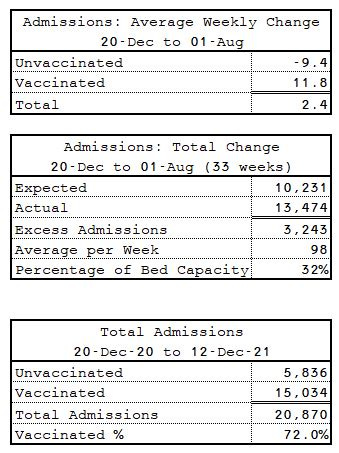
Over the whole period between 03-Jan-21 and 01-Aug-21 (Table 6), there is a substantially positive average weekly increase in overall admissions.
In percentage terms it represents an increase over expectations of 35% of normal bed capacity. Overall, 68.5% of admissions were in the vaccinated which is almost exactly the same as the background population rate.

The correlation plots (Figure 12) confirm the trend analysis and overall statistics. They reveal that there is little correlation between total admissions and either vaccinated admissions or unvaccinated admissions up to the midpoint of mass vaccination.
However, after the midpoint, unvaccinated admissions continue to show little correlation, whereas vaccinated admissions are strongly correlated with a relationship that is more than five times stronger.
It is clear that vaccinated admissions are driving the rise and variation in admissions for this age group after the healthcare workers have been vaccinated.
7.Hospital admission rates by vaccination status, ages 70 years and over
Looking at Figure 13, we observe that vaccinated admissions start in earnest on 20-Dec-20 for patients aged 70 years and over. The mid point of vaccinations was on 24-Jan-21.
In contrast to the younger age groups, we do not see a rise in total admissions concomitant with a rise in vaccinated admissions for the first few weeks when the oldest and frailest are being vaccinated. The concomitant rise that we have observed in all the other age groups does not start until the midpoint of vaccinations on 24-Jan-21 when all of the oldest and frailest have been vaccinated.
According to Figure 14, the vaccinated admission rate does not significantly deviate from the vaccinated population rate for the first five or six weeks before running substantially below it.
This might suggest that the vaccine had no impact on the oldest and frailest. In other words, those hospitalised were going to be so, vaccinated or not.
Thereafter, the plausible explanation given to me by one of my practicing clinician colleagues why the vaccinated admission rate tapers more rapidly than the background population rate is perhaps that those who might previously have been hospitalised unfortunately no longer made it that far. This might also explain why all admissions fall precipitously below expected levels in October, after boosters are given and fits with my previous analyses on deaths, e.g.
Over the whole period between 03-Jan-21 and 01-Aug-21 (Table 6), there is a substantially positive average weekly increase in overall admissions.
In percentage terms it represents an increase over expectations of 32% of normal bed capacity which might now suggest that my estimate of 7 days hospital duration was too high and it is actually closer to 5 days. Overall, 72% of admissions were in the vaccinated which is substantially less than the average population rate for the period of 82%.

The correlation plots (Figure 15) confirm the trend analysis, that before the midpoint where it is mainly the 80+ year olds being vaccinated, there is little difference in the vaccination status in terms of driving the variability in admission rates.
However, after the midpoint, unvaccinated admissions correlation falls substantially, whereas vaccinated admissions remain strong, up to four times higher.
Once again, it is apparent that vaccinated admissions are driving the rise and variation in admissions for this age group after the the oldest and most frail have been vaccinated.
The analysis of the admission trends and correlations in weekly variability show that timing of vaccination roll out, age and health status affect hospital admission rates and timings just as vaccination status does.
However, it is also clear that taking these variables into consideration, plausible explanations can be given to explain the differences.
The ultimate conclusion is the same across all age groups as it was for the aggregate data - there is substantial evidence showing that COVID vaccinations are the main driver of changes in overall hospital admissions. Since inception, admissions are higher than expected for several months, strongly suggesting that the vaccines cause more hospitalisations than they mitigate.
8.Glossary
Coronaviruses
The World Health Organization (WHO) defines coronaviruses as "a large family of viruses that are known to cause illness ranging from the common cold to more severe diseases such as Middle East Respiratory Syndrome (MERS) and Severe Acute Respiratory Syndrome (SARS)". Between 2001 and 2018, there were 12 deaths in England and Wales because of a coronavirus infection, with a further 13 deaths mentioning the virus as a contributory factor on the death certificate.
Coronavirus (COVID-19)
COVID-19 refers to the "coronavirus disease 2019" and is a disease that can affect the lungs and airways. It is caused by a type of coronavirus. Further information is available from the WHO.
Hospitalisations involving COVID-19
Hospitalisations as published on the UK Coronavirus Dashboard.
Data
In the interest of full transparency, a copy of the data, analysis tables and figures (and more besides) is available here.
9.Strengths and limitations
This analysis does not rely on biased or misleading vaccination classifications whereby vaccinated patients would be classified as unvaccinated within a certain number of weeks of being vaccinated or simply censored from the data. Nor does it only examine COVID endpoints rather than all endpoints and consider “fully vaccinated” as the only important outcome.
Unvaccinated also includes unknown vaccination status, i.e. where the patient record could not be matched to the National Immunisation Status database and/or was not known to the hospital by some other means.
10. Acknowledgement
I would like to publicly acknowledge and thank the FOI Team and anyone else at Gloucestershire Hospitals NHS Foundation Trust for the effort put into putting the data together and delivering it within the statutory limit.
https://www.whatdotheyknow.com/request/covid_vaccination_status_of_hosp_9
https://www.ons.gov.uk/peoplepopulationandcommunity/birthsdeathsandmarriages/deaths/bulletins/deathsinvolvingcovid19byvaccinationstatusengland/deathsoccurringbetween1januaryand31october2021
https://yellowcard.ukcolumn.org/yellow-card-reports






Wow, I am impressed that my local NHS trust has supplied you data. I know nurses that work in our local hospitals and they all keep trotting out the same "unvaccinated are filling the ICU and wards". I wish they would open their eyes and minds to real world info and data instead of media driven tosh and canteen gossip. Thank you for your work on this data.
After looking at this data, I'm not sure if mass vaccination is mass infection promotion, mass hospitalization promotion, mass mortality promotion or all three. Clearly, it's not reducing anything.