Methodology for Estimating Excess Mortality #4 - Normalised Gompertz
Finally attained a robust and reliable model.
For the foundation of this process of modelling see iterations #1 through #3 from here:
Methodology for Estimating Excess Mortality #3 - Gompertz
For the foundation of this process of modelling see iteration #1 (linear fitting to the periodic data) here: And iteration #2 (polynomial fitting to the cumulative series) here: Both methods had their limitations. The linear model did not capture the convexity in the younger ages. the polynomial model captured too much convexity and too much of the concavity in the older ages.
In this final iteration, I have settled on a “normalised Gompertz” model. Before, going into a little detail, in essence, it simply forecasts the next unknown point in the series of one age cohort by reference to the average relative change in the same period for the five older cohorts, over the previous five years.
In practice, it requires combining all the five-year integrals into a single Gompertz distribution spanning all ages from 7 to 88, referenced by mortality outcomes in the period Jan 2015 to Feb 2020, i.e. the entire reference data up to the point of the COVID pandemic declaration.
For the exact details, here is the workbook.
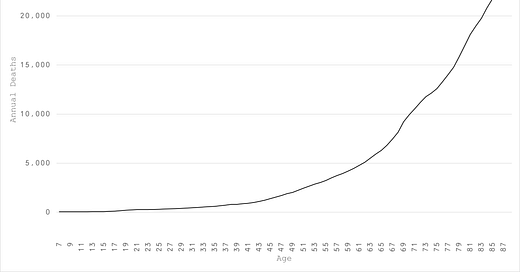
For the summary output, here is the Gompertz for a typical age cohort in England & Wales, starting with around 5 deaths in the first month of age 7 (Figure 1):
There were a couple of serendipitous insights from this modelling. The “reckless adolescent” hump is still most apparent (Figure 2):
However, I also discovered a smaller hump for those born in the 1940s (Figure 3):
This is not (entirely) due to cohort size because I modelled relative change and I’m not going to speculate why this should be but suffice to say, that these humps must be taken into consideration when estimating excess mortality.
Moreover, when more data is available, we can further determine if this is only a 1940s thing or a more general situation affecting those who turn 68 until their 75th birthday.
For the limited forecasts of this model (3 years), if it is the former, it is not going to materially affect the overall outcomes.
After production of the normalised Gompertz, the model was further calibrated to the empirical data for each age cohort between Jan-15 and Feb-20 to rescale. Subsequently, excess deaths were calculated in the usual, simple fashion, as the difference between actual deaths from Mar-20 onwards and the deaths estimated by the model.
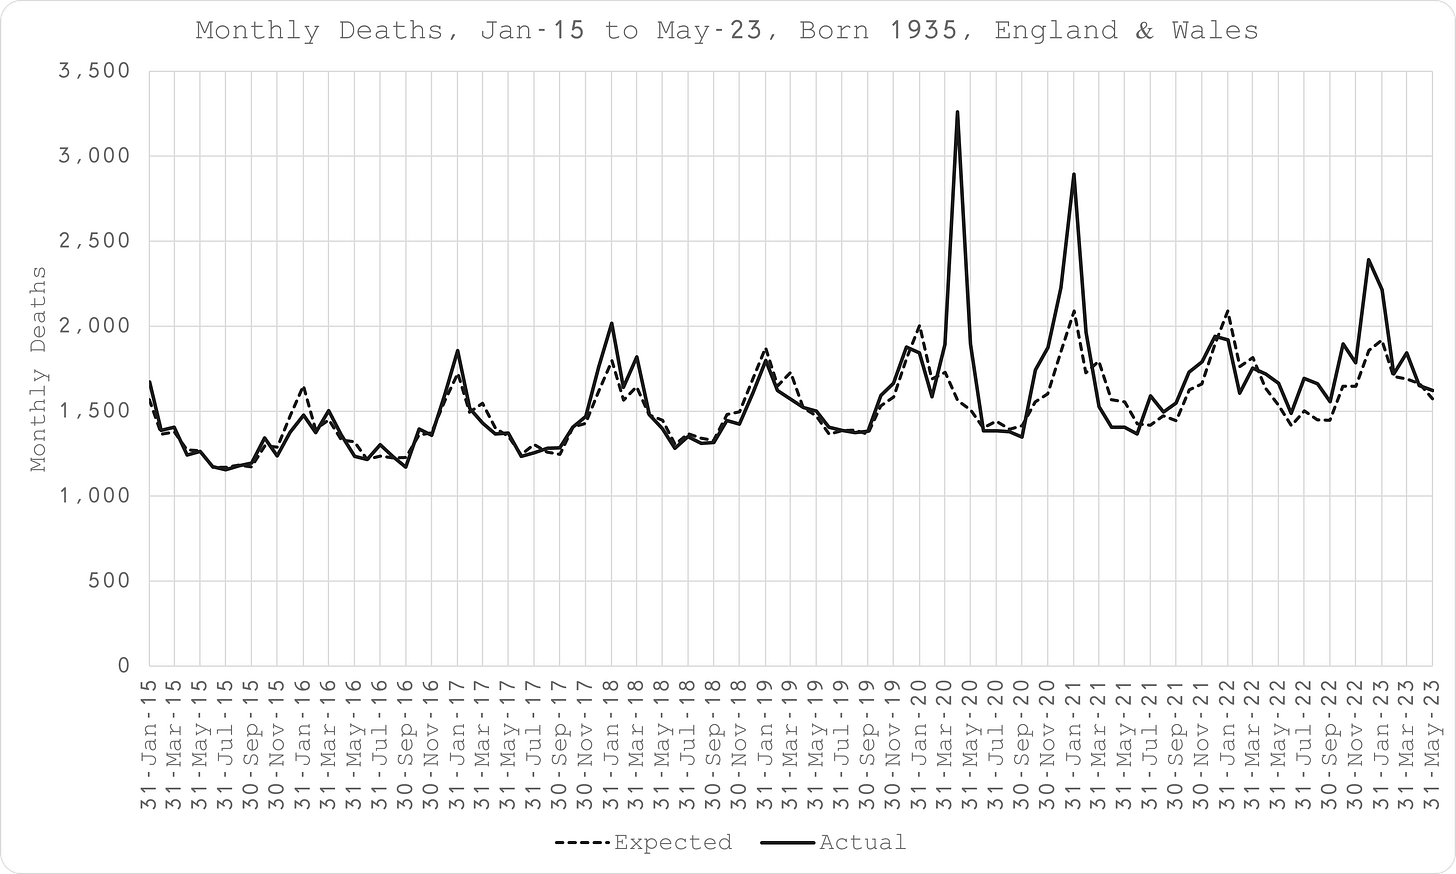
An example of a single birth year comparison of actual data and model estimate is shown in Figure 4 for those born in 1935 (aged 85 at the start of the pandemic).
It is evidently a very good fit, intuitive, captures the seasonality and age-dependent dynamics well. It is robust, since the exact same model yielded the same quality of results for all age cohorts without any further adjustment:
The results for all ages, aggregated after modelling each year separately as usual, are below - Figure 5 (monthly) and Figure 6 (cumulative with milestones):
As it happens, the overall, final tally is not far off that produced by my original model #1. Nevertheless, the bulletin will be reviewed and revised accordingly, going into detail for each range of birth year cohorts, which are somewhat different, especially in the younger ages.


Have you connected with Denis Rancourt yet, Joel, and are you aware of his latest excess mortality analysis putting the injection death tally at 17 million (1 death per 470 living persons)?
“We quantify the overall all-ages vDFR for the 17 countries to be (0.126 ± 0.004) %, which would imply 17.0 ± 0.5 million COVID-19 vaccine deaths worldwide, from 13.50 billion injections up to 2 September 2023. This would correspond to a mass iatrogenic event that killed (0.213 ± 0.006) % of the world population (1 death per 470 living persons, in less than 3 years), and did not measurably prevent any deaths.” (https://denisrancourt.substack.com/p/covid-19-vaccine-associated-mortality)
I had previously been using Denis’s May 2023 National Citizens Inquiry presentation along with his 894-page book of exhibits to support his calculation that 13 million had been murdered by injection to date (video and associated links included in my last article: https://margaretannaalice.substack.com/p/dissident-dialogues-margaret-anna), and now that total is up to 17 million. Gob-bloody-smacking.
I'll be honest and say I haven't fully understood what you did.
However I'd like to point out that any excess mortality measure fails to capture short-term changes if it uses pre-COVID data. People were dying of all kinds of things in the COVID-era and if I want to know the impact of vaccinations, all these paths water down the relationship between vaccinations and deaths.
The best success I've had is simply using an individual reference timeframe where all the factors impacting mortality I do not care about are already present.
For Q3/2021 in the USA this is June/2021, where mortality is at a COVID-era low. When I do that and run regressions between vaccination rates and doses, I get really impressive results.