The COVID "cure" is worse than the disease.
Analysis of life-years lost in England shows a 76% increase in 2021 over 2020 because younger people are dying at much higher relative rates.
Some things are indisputable. Death is one of them.
It is an undeniable, incontrovertible fact that deaths in England in 2021 are higher than 2020 (Figure 1). 2020 was the year that COVID, the “deadliest pandemic since the Spanish flu”1, hit our shores. Allegedly, it warranted an unprecedented grant of power to politicians and their small, unelected group of “experts”, to dictate every facet of our daily life in an attempt to defeat it.
2021 was the aftermath where we ended up with the collateral harm caused by the measures implemented by the government to thwart the virus.
In absolute terms, there were 570k deaths in 2020, of which 76k were within 28 days of a positive PCR test, “with COVID”. In 2021, there were 591k deaths, of which 73k were “with COVID”. So, 3k fewer “with COVID” deaths but 21k extra deaths overall.
Unfortunately, we have already demonstrated that the government measures played no part whatsoever in mitigating transmission or death2. So, we’re just left with a comparison between who the virus killed and who the government killed. On face value, it looks like the government has already won and we’ve only had one year so far.
I say face value because absolute mortality, although absolute, is not the best measure when judging public health outcomes. I have done a quick bit of modelling to remove confounding of shifting demographics over time by estimating an expected level of mortality using a simple polynomial fit to the historic data.
I actually did this for each individual age group then aggregated the results so make it even more accurate. Against this baseline, we can see that 2020 resulted in 15% more deaths than expected but 2021 had 20% more, against a very slight decrease in expectations.
But there is no need to dwell on the limitations of that methodology because we should really be looking at life-years lost. Paraphrasing from Wikipedia’s Quality-Adjusted Life Year definition3 because I have not adjusted for “quality of life”, it represents:
a generic measure of quantity of life lived. It is used in economic evaluation to assess the value of medical interventions.
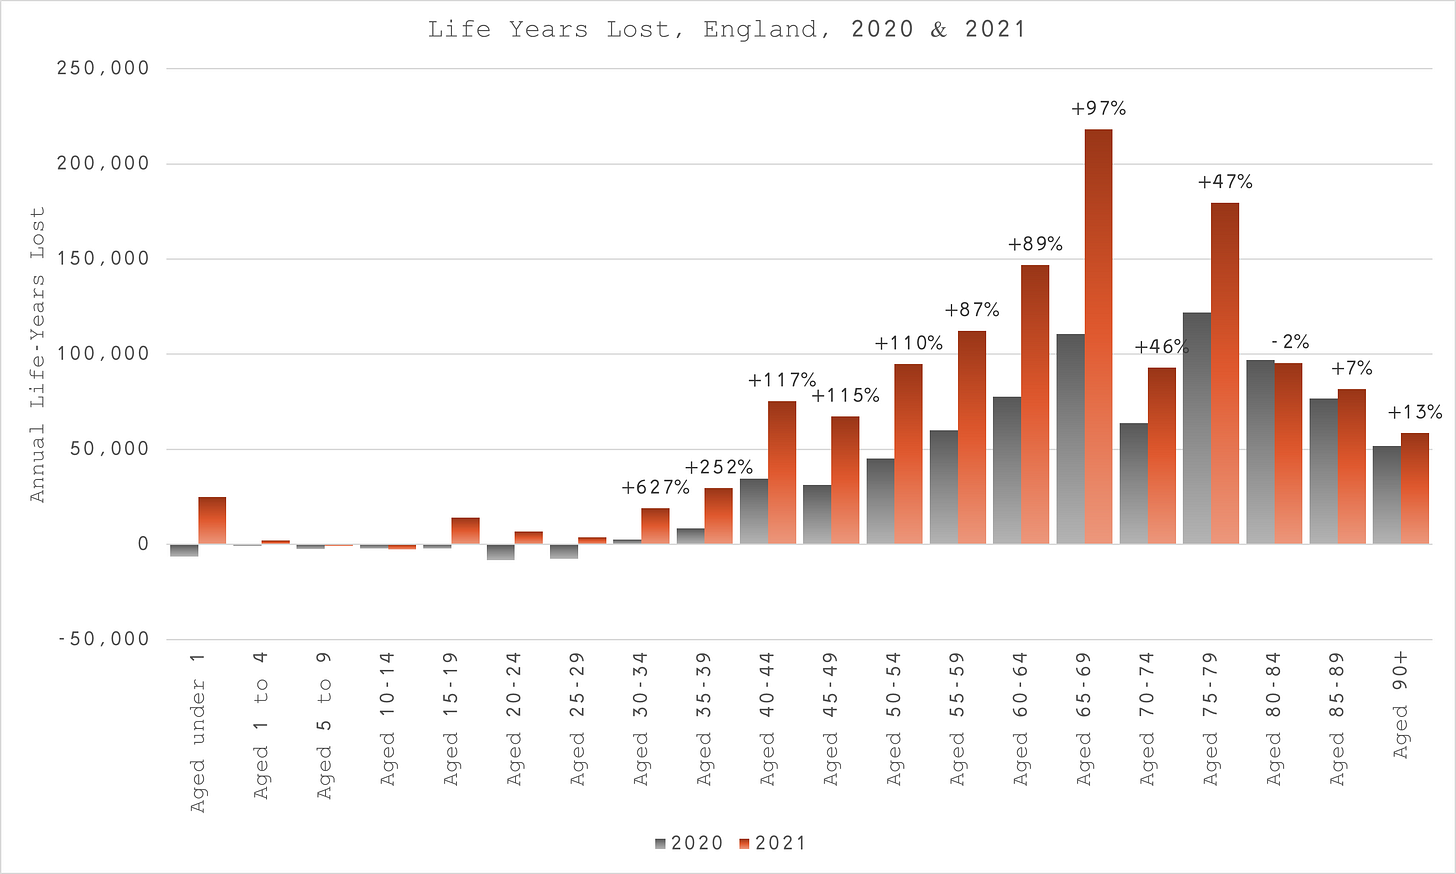
Using this more appropriate measure then (Figure 2), we can see that the situation is much worse than a 5% absolute increase in absolute deaths. Overall, there is a 76% increase in life-years lost in 2021 compared to 2020 but in relative terms, apart from the 65 to 69s, it gets progressively worse, the younger you go.
The reason for this is due to the fact that much younger people died in greater numbers in 2021. Let’s take a closer look at each age group in turn.
Aged Under 1
Figure 3 must surely strike everyone to the heart who isn’t completely consumed by the COVID psychosis. Baby deaths had fallen substantially between 2018 and 2020. I can’t think how babies could be affected by the non-pharmaceutical COVID interventions (positively or negatively) and they aren’t directly affected by COVID itself, so how can we explain the sudden reversal of this trend in 2021, a 17 point swing relative to the rough expectation from 2020?
Ages 1 to 4 and 5 to 9
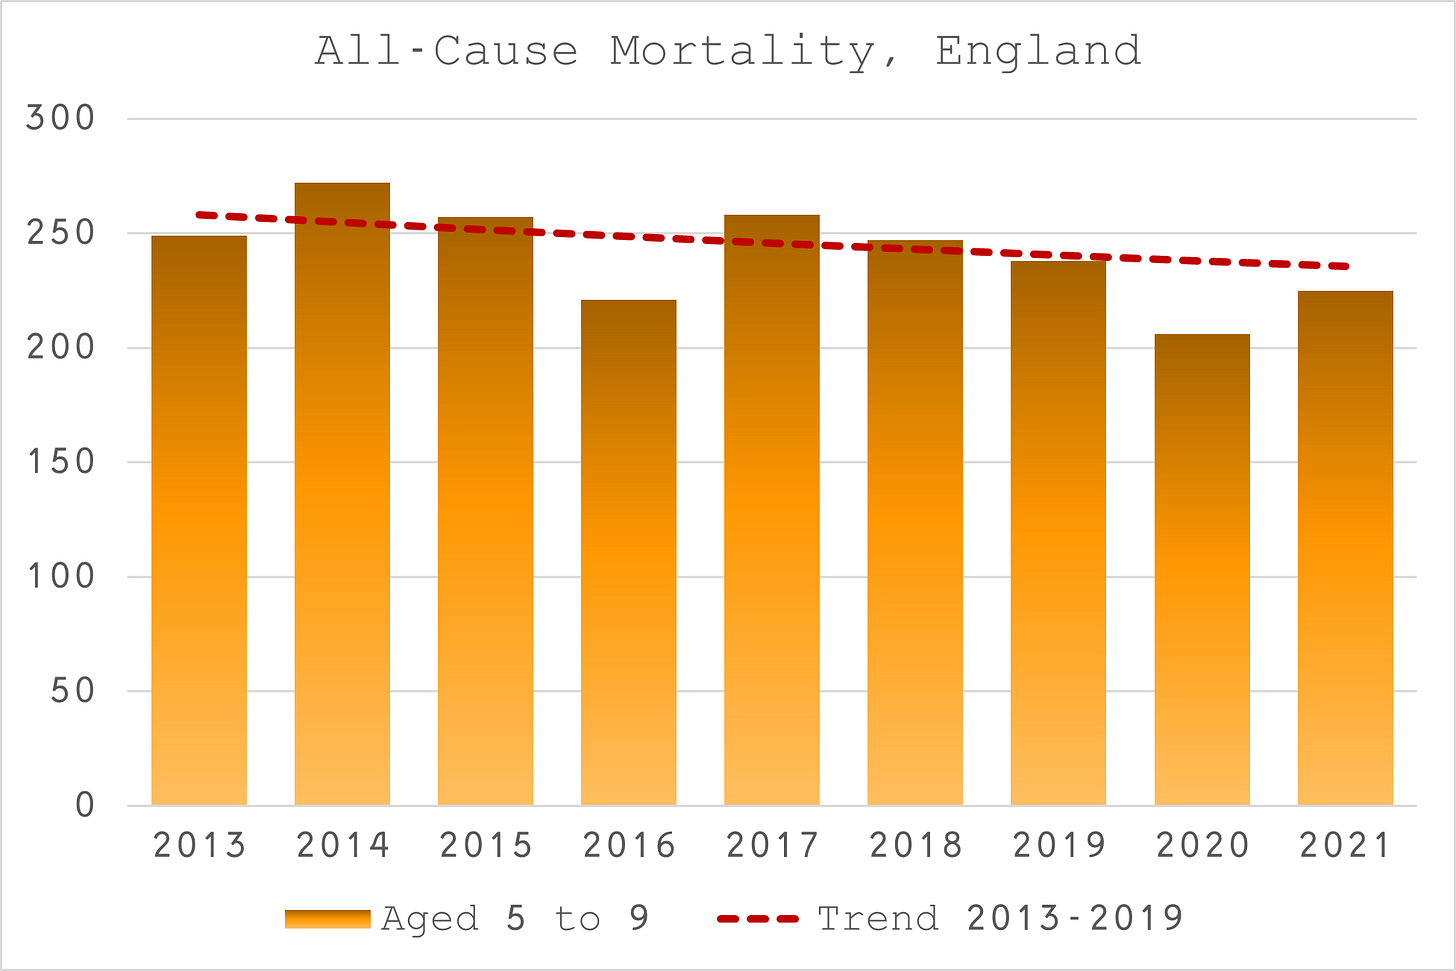
To compound the findings of baby mortality, we don’t see that pattern at all in the 1 to 9 year olds (Figures 4 and 5). I’m a big fan of Occam’s razor. 1 to 9 year olds were not vaccinated but babies born in 2021 to vaccinated mothers effectively were. What would be the implication of that?
Ages 10 to 19
Just as troubling is the significant divergence between the 10 to 14 year olds and the 15 to 19 year olds in 2021 (Figures 6 and 7). Although there is obvious variance between the two cohorts in previous years, 2021 stands out after neither group is evidently affected in 2020 when COVID was rife. Again, considering Occam’s razor, 15 to 19 year olds were vaccinated in 2021, 10 to 14 year olds were not. What is the implication of that?
Ages 20 to 29
Ages 20 to 29 present a bit of an enigma for me. Although higher in 2021, the 20 to 24 year olds have not suffered to anywhere near the same relative extent as the 25 to 29 year olds. Perhaps this can be explained by the same reason why the variation in 25 to 29s has always been higher. Perhaps the younger age group had paid attention to the plethora of vaccine adverse events and declined it when it was their turn?
Even so, the rise in 2021 is substantial. Whether we look at the vaccine again for this or consider the impact of the other interventions (denial of healthcare, increased stress, etc.) is moot. They are all government policy.
Ages 30 to 39
Ages 30 to 39 (Figures 10 and 11) were clearly not affected by COVID in terms of mortality. Neither age group sits materially above expectation in 2020. Alas, the same cannot be said for 2021, showing marked increases above trend in both groups. Have they paid the price, doing the “right thing” for the “greater good”?
Ages 40 to 79
Ages 40 to 79 (Figure 12) all show the same pattern - increased deaths in 2020 but more still in 2021, so I aggregated them. In life-years terms, it represents an 81% increase from 545k to 987k.
Ages 80+
The only age group not to show a substantial increase in deaths in 2021 compared to 2020 is the over 80s (Figure 13). Both years show around 16% increase in deaths compared to the trend. In life-years terms we’re talking a modest 5% increase in 2021 relative to 2020.
The cure is already worse than the disease. The cure is a virus also known as totalitarian government. It’s spreading across Europe and will land on English shores soon if we do not stop it. The vanguard has been pushed back a couple of times but the Welsh and Scottish have already shown serious signs of weakness.
If you don’t want your children to grow up in a miserable, fascist state or worse still die in it, I suggest you start paying more attention to the data and less to the propaganda on the television. The government is not your friend and does not have your best interests at heart.
https://www.theguardian.com/politics/live/2020/mar/23/uk-coronavirus-live-news-latest-boris-johnson-minister-condemns-people-ignoring-two-metre-distance-rule-in-parks-as-very-selfish
https://en.wikipedia.org/wiki/Quality-adjusted_life_year


Once again, we have the vaccine effect. As if care homes were not targeted enough in 2020, January 2021 gave us a preview of what was in store more generally. In that month, weekly care home deaths suddenly leapt by 70% over December levels. This, of course, follows their targeting by vaccines in December.
Patterns of excess death by age group again show the same thing - excess deaths ramping up or accelerating only after the respective groups are targeted.
As shown, the only exception appears to be the highest age group - I guess there just are not enough survivors to get the total numbers up. Really, you have to be impressed by the way the government has relentlessly sought to ensure that there are no witnesses to how the elderly have been brutally put down as a matter of policy.
Of course, under normal circumstances, a major health crisis would be declared with so many younger age groups showing sharp increases in excess deaths. The fact that this catastrophe isn't even mentioned or acknowledged says a great deal.
Remember also, we're just getting started; those who got the ticket to the vaccine party are increasingly finding out that there's only one way they get to leave early.
Quite simply this is the most important perspective any "public health authority" ought to have.
Did we kill people who wouldn't have died, and did they die miserably or unexpectedly. Likely, yes and yes. Will our current policies reverse the trends?
No, it will accelerate it beyond the pale. Because the cure was sold to people who were most vulnerable to the Government subsidized virus, and the governments are addicted to killing the people they proclaim to protect. Then tell the people in grief, fear and anger to direct it at those who stood firm and saw through it all. Has worked so far for them. Will it stop working now?
I think so.