The Definitive Guide to COVID and COVID vaccine deaths.
Analysis of unadulterated death certificate data from Massachusetts provides conclusive evidence for the tribunals.
Throughout the COVID pandemic, we have been pleading for good quality data so uncompromised analysts like me can produce independent research as a counter narrative. This is the absolute essence of good science and evidence-based decision making.
Finally, as a result of an FOIA, we have access to seven full years of complete death certificate records for the state of Massachusetts, USA.
These are my insights.
Classifications
SEPSIS (Auto-immune response to infection)
CANCER (Bladder, colon, esophageal, glioblastoma, lung, metastatic, breast, ovarian, pancreatic, prostate)
NEURODEGENERATIVE DISEASES (Parkinson’s, Alzheimer’s, Dementia)
CARDIOVASCULAR (Anoxic brain injury, arrhythmia, hypertensive & atherosclerotic, cardiac arrest, cardiogenic shock, myocardial infarction, myocarditis, pericarditis, stroke, vascular dementia, cardiovascular collapse, heart failure, coronary heart disease)
RESPIRATORY (Acute distress syndrome, pneumonia, COPD, hypoxia, arrest/failure)
ORGAN FAILURE (Liver, kidney, gastrointestinal, multi-system organ failure, failure to thrive)
MISADVENTURE (Drug overdose, hanging)
COVID-19
COVID emerged in Massachusetts as a mortality event on 18-Mar-20 and was finished 17 weeks later on 15-Jul-20 (Figure 1). During that time, deaths where COVID-19 was mentioned on the death certificate (i.e. not necessarily the primary cause of death), represented 30% of all deaths.
The state introduced a wide range of non-pharmaceutical interventions (NPIs) on 25-Mar-20, including general business closures (retail, bars and restaurants), and bans on gatherings. In theory, these NPIs should have caused the distribution of actual COVID-19 deaths to be smaller than the deaths predicted by a continuous mathematical function1 but evidently they are not. None of these NPIs had any impact whatsoever on COVID-19 mortality. All the death that was going to occur did occur. No lives were saved.
On 17-Apr-20, the state introduced a mandate for everyone to wear a mask when outside their home when other people were present. Since that mask mandate, the rate of decline of COVID-19 deaths actually slowed down rather than sped up which would have been the outcome if the policy were effective. It was not.
On 10-Jun-20, the general closures were lifted. There was no apparent surge in COVID-19 deaths as predicted by the epidemiological models. In fact, the course of COVID-19 mortality continued its decline to zero due to natural causes (temporal herd immunity and seasonality). This was predictable, predicted and happened.
On 07-Oct-20, the mask mandate that had remained in effect was increased to include any time a person was outside their home regardless of location or the presence of other people. Immediately, at that time, COVID-19 mortality began to rise again. This is more likely to be a seasonal resurgence irrespective of the completely ineffectual mask mandate rather than because of it. This wave of COVID-19 mortality lasted for 32 weeks until 19-May-21 but there were 40% less deaths than the spring wave, representing 13% of all deaths during that period. Viruses naturally attenuate due to the logical advantage of less virulent strains to out-compete more virulent ones. Again, predictable, predicted and happened.
On 19-May-21, the mask mandate was lifted but there was no subsequent resurgence in COVID-19 mortality which would be expected if the mask mandate had been effective. It is more likely that the COVID-19 outbreak ended again due to temporal herd immunity and seasonality. Idem.
The distribution of deaths where COVID-19 was attributed as the main cause follows the exact same pattern as that where COVID-19 was mentioned on the death certificate (Figure 2).
Conversely, COVID-19 only represented 6% of all deaths during the spring epidemic and 3% during the seasonal return of autumn 2020 all the way through to spring 2021. Evidently, COVID-19 was and still is not a significant cause of death for otherwise healthy people.
Deaths of Ages 5 to 11 Year Olds
During the pandemic year of 2020, deaths of children aged 5 to 11 were significantly lower than usual (compared to the 5-year average with a range of +/- two standard deviations from the mean). There were around half as many deaths as usual (Figure 3).
During 2021, deaths were in line with expectations before breaking down in a similar fashion to 2020 between April and June. However, there was a sharp rise in deaths in July, returning deaths to their usual trajectory.
There does not appear to be any single cause of this rise. Misadventure is the only category that ended the year above the upper bound of expectation with four deaths in total.
There were no deaths at all due to COVID-19 in this age group and only one where COVID-19 was mentioned, i.e. the child died of something else but COVID-19 might have contributed to the death.
Deaths of 12 to 15 Year Olds
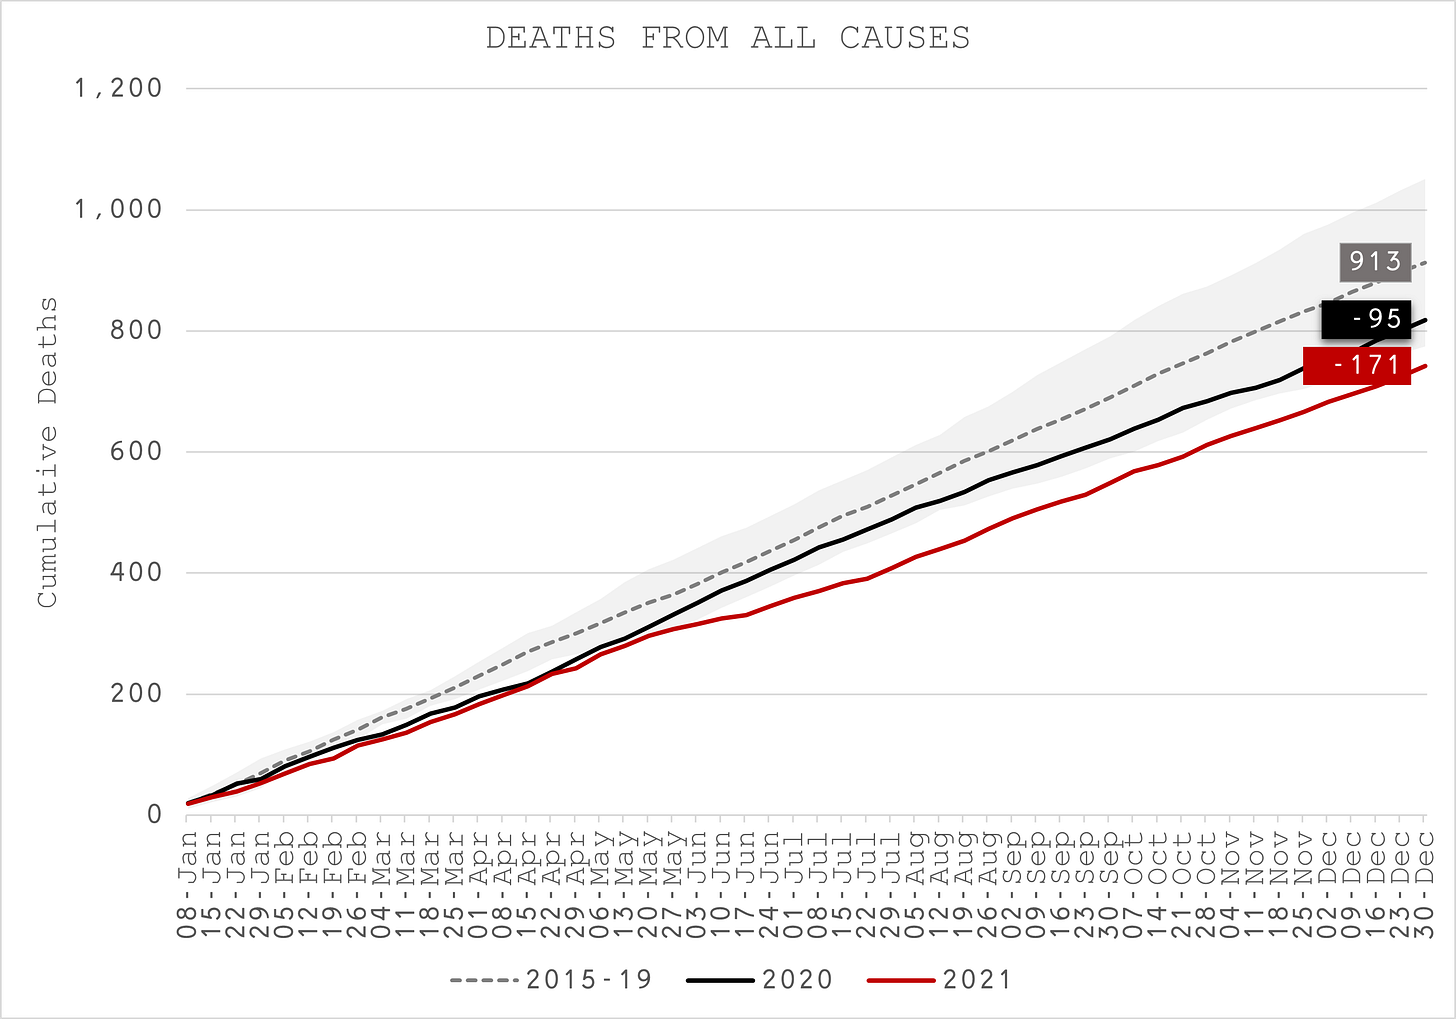
During both 2020 and 2021, deaths of children aged 12 to 15 were significantly lower than usual with around 20% less deaths (Figure 4).
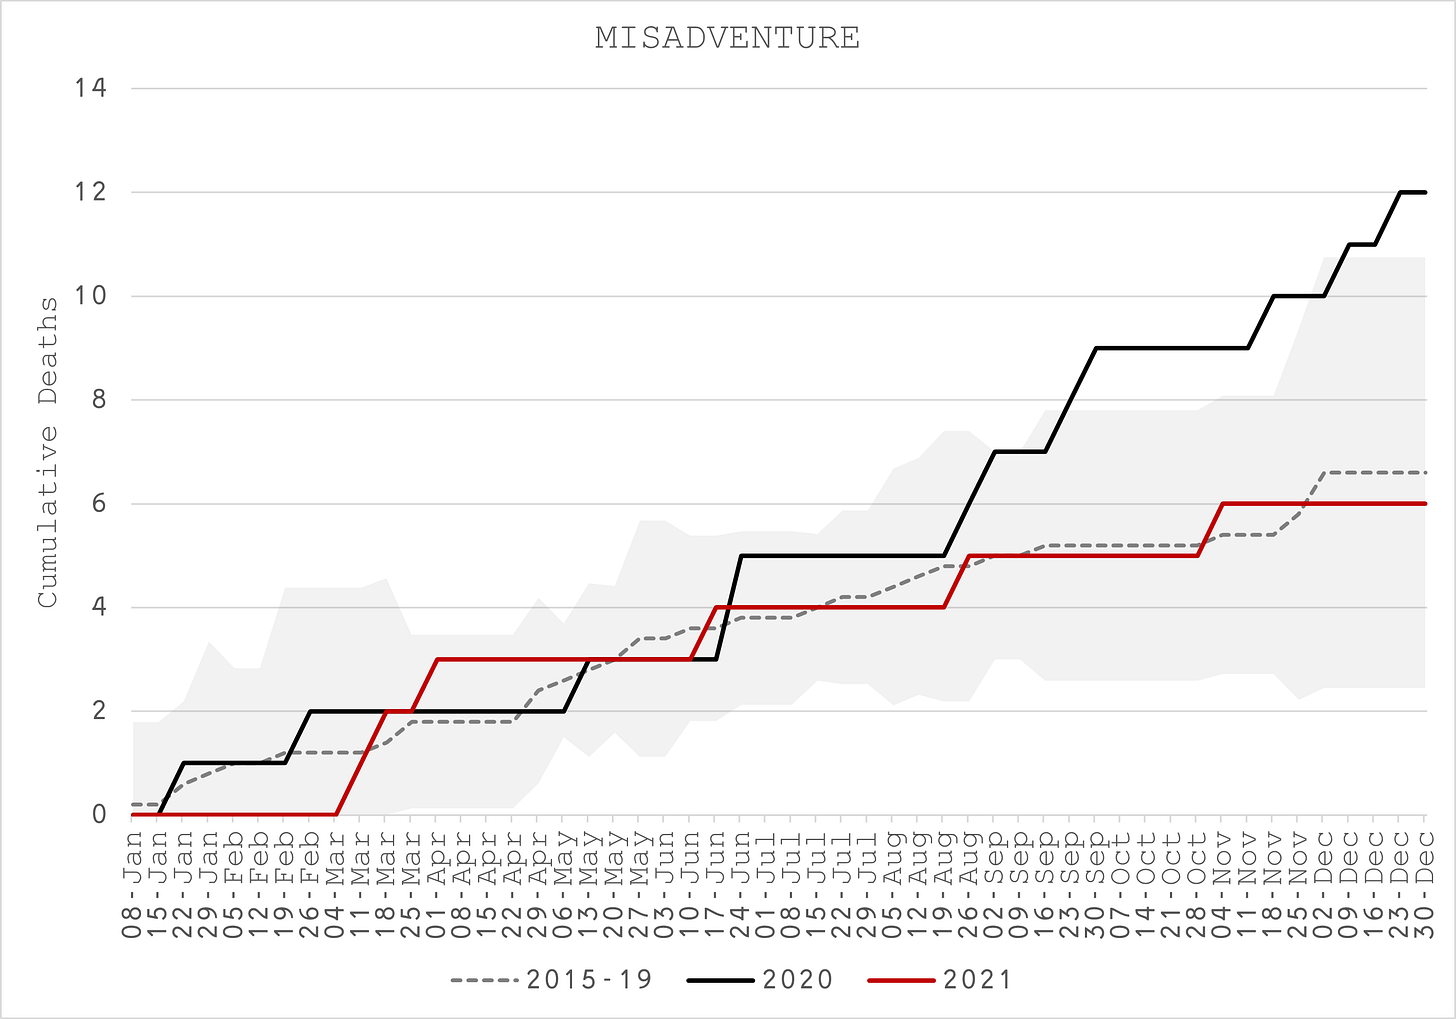
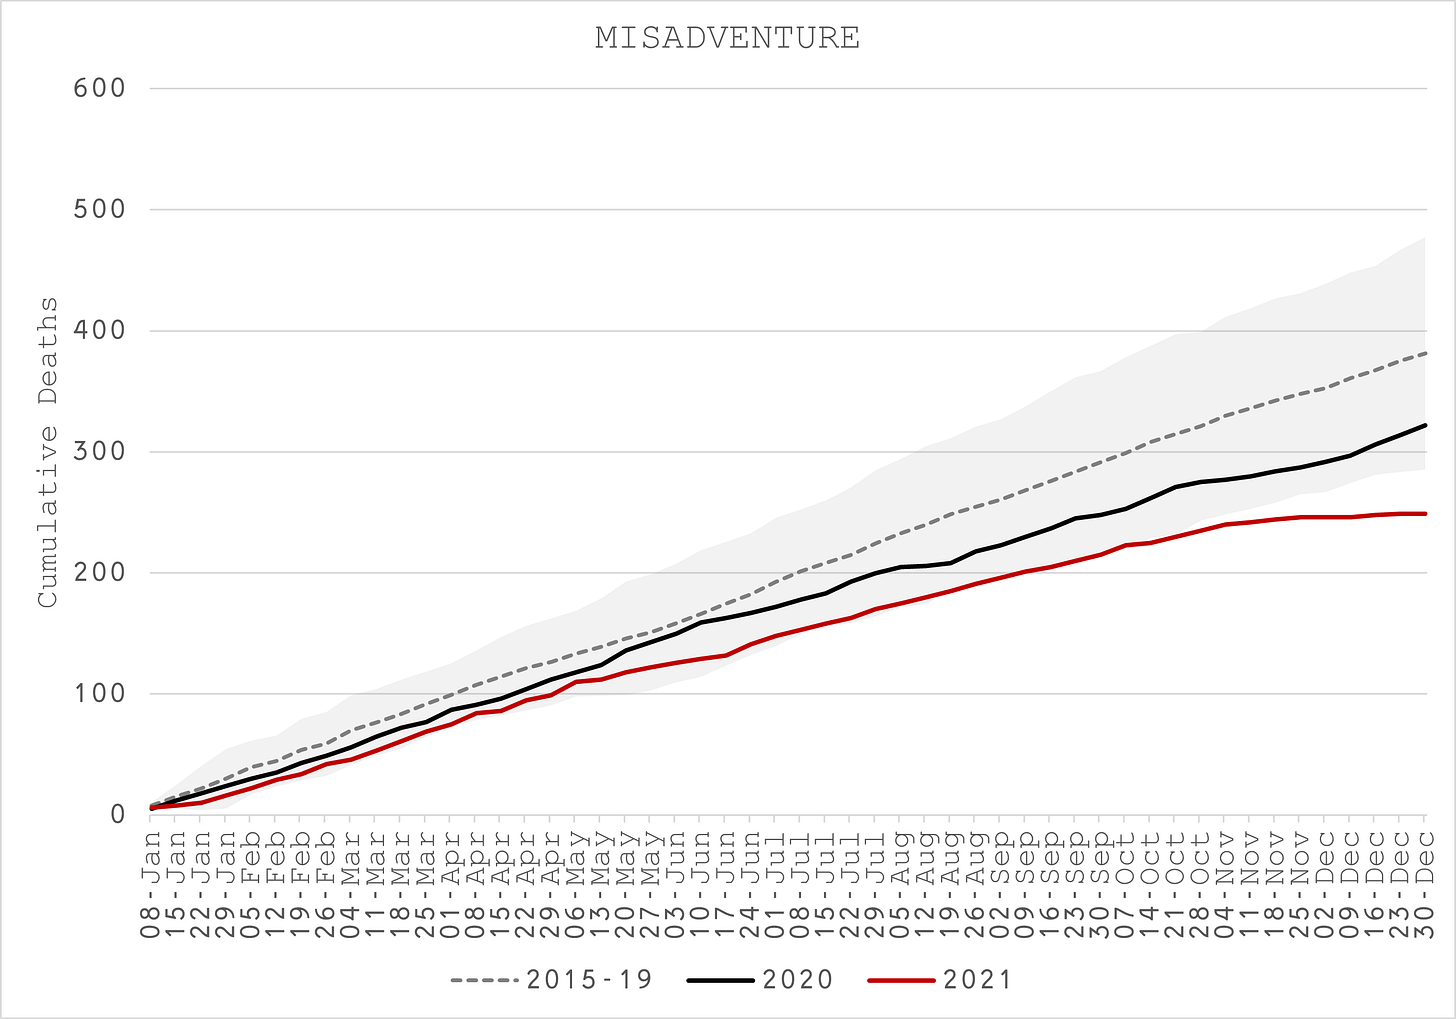
However, misadventure is the only category that ended the year above the upper bound of expectation in 2020 with twelve deaths in total, twice as many as usual (Figure 5)
There were no deaths at all due to COVID-19 in this age group but six where COVID-19 was mentioned.
Deaths of 16 to 19 Year Olds
During the pandemic year of 2020, deaths of teenagers aged 16 to 19 were more-or-less in line with expectations with an evident, albeit insignificant hump during the spring epidemic (Figure 6).
During 2021, deaths were in line with expectations before breaking up in in mid-May, ending the year just over 8% higher than usual but just inside the upper boundary.
Misadventure is once again the only category that ended the year above the upper bound of expectation with 35 deaths in total, 45% more than usual.
There was just one death due to COVID-19 in this age group in 2021 but none in 2020, and 3 mentioned in 2020 compared to 5 in 2021 (Figure 7).
The rise in deaths in 2021 also coincides with the middle of the main mass vaccination of this age group (Figure 8).
Deaths of 20 to 29 Year Olds
Deaths of 20 to 29 Year Olds were 10% lower than usual in 2020 and almost 20% lower in 2021 (Figure 9).
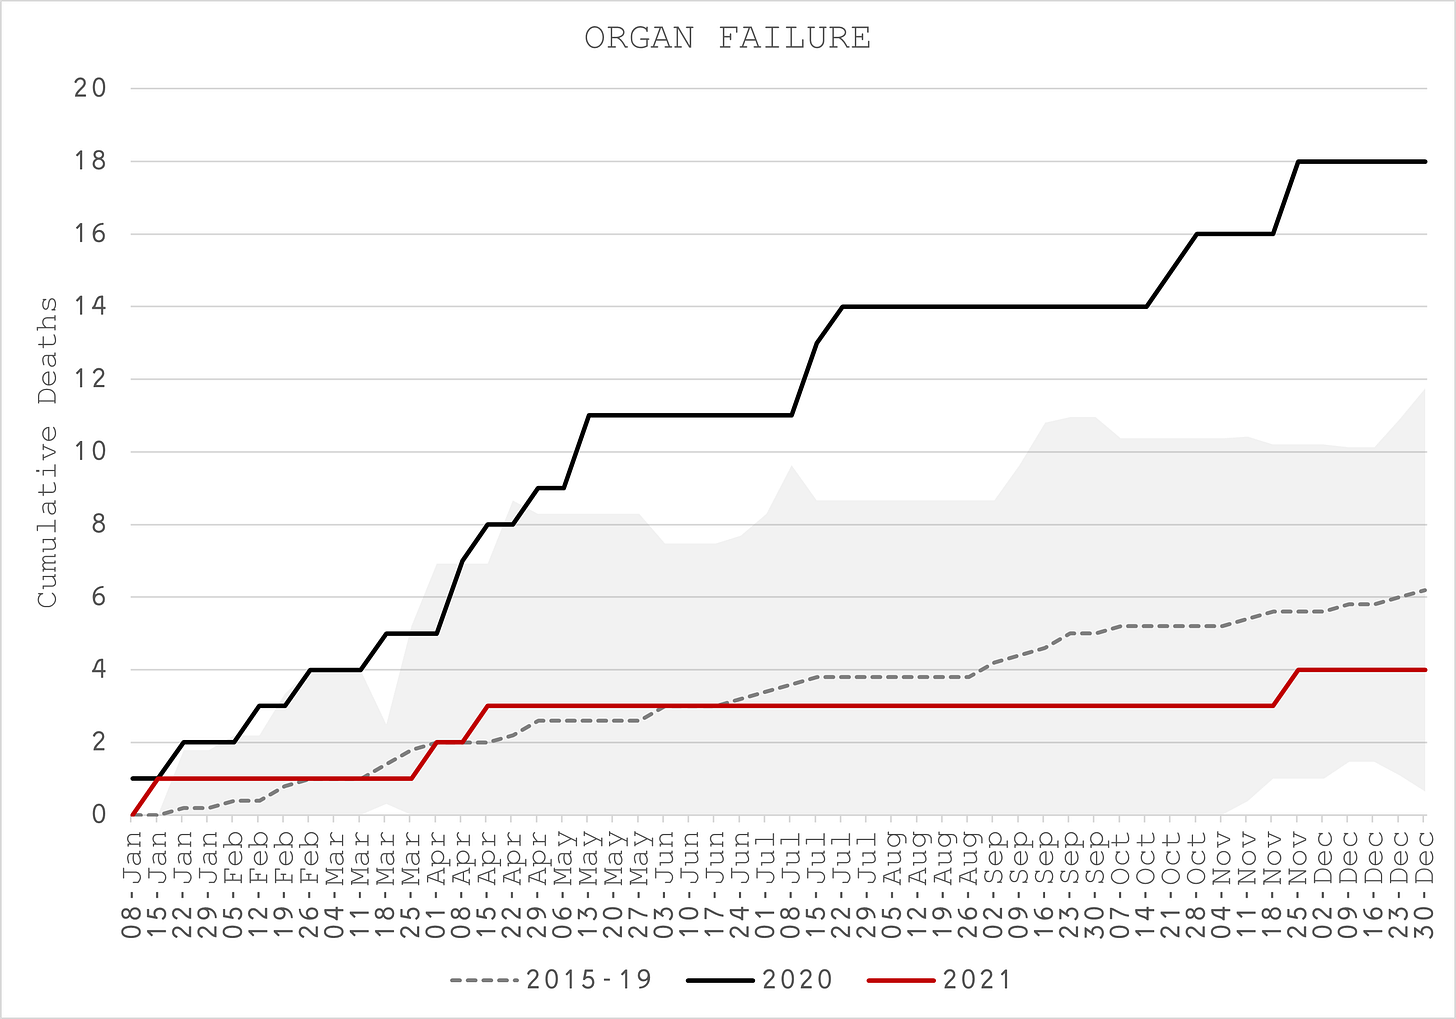
However, this is mainly due to substantially lower deaths due to misadventure (Figure 10), offset by higher deaths in cardiovascular (Figure 11) and organ failure (Figure 12) in 2020. Note however, 2021 misadventure deaths look incomplete.
Take a good look at when cardiovascular deaths rise precipitously in this age group - start of June (Figure 11). Now look at when deaths with a mention of COVID-19 ended - start of June (Figure 13). In other words, all the excess deaths are due to policy interventions (restriction-induced stress, denial of healthcare?).
There were four cases each year where COVID-19 was the primary cause of death, i.e around 0.5% of all deaths. However, it was mentioned 13 times in 2020 compared to 28 times (more than twice as often) in 2021 (Figure 13).
Deaths of 30 to 39 Year Olds
Deaths of 30 to 39 Year Olds were 15% higher than usual in 2020, way outside the upper boundary and do not coincide with the COVID-19 outbreaks (Figure 14).
In 2021, they were higher still at +22%.
Organ failure deaths are higher than expected but the main culprits are cardiovascular (Figure 15) and respiratory (Figure 16).
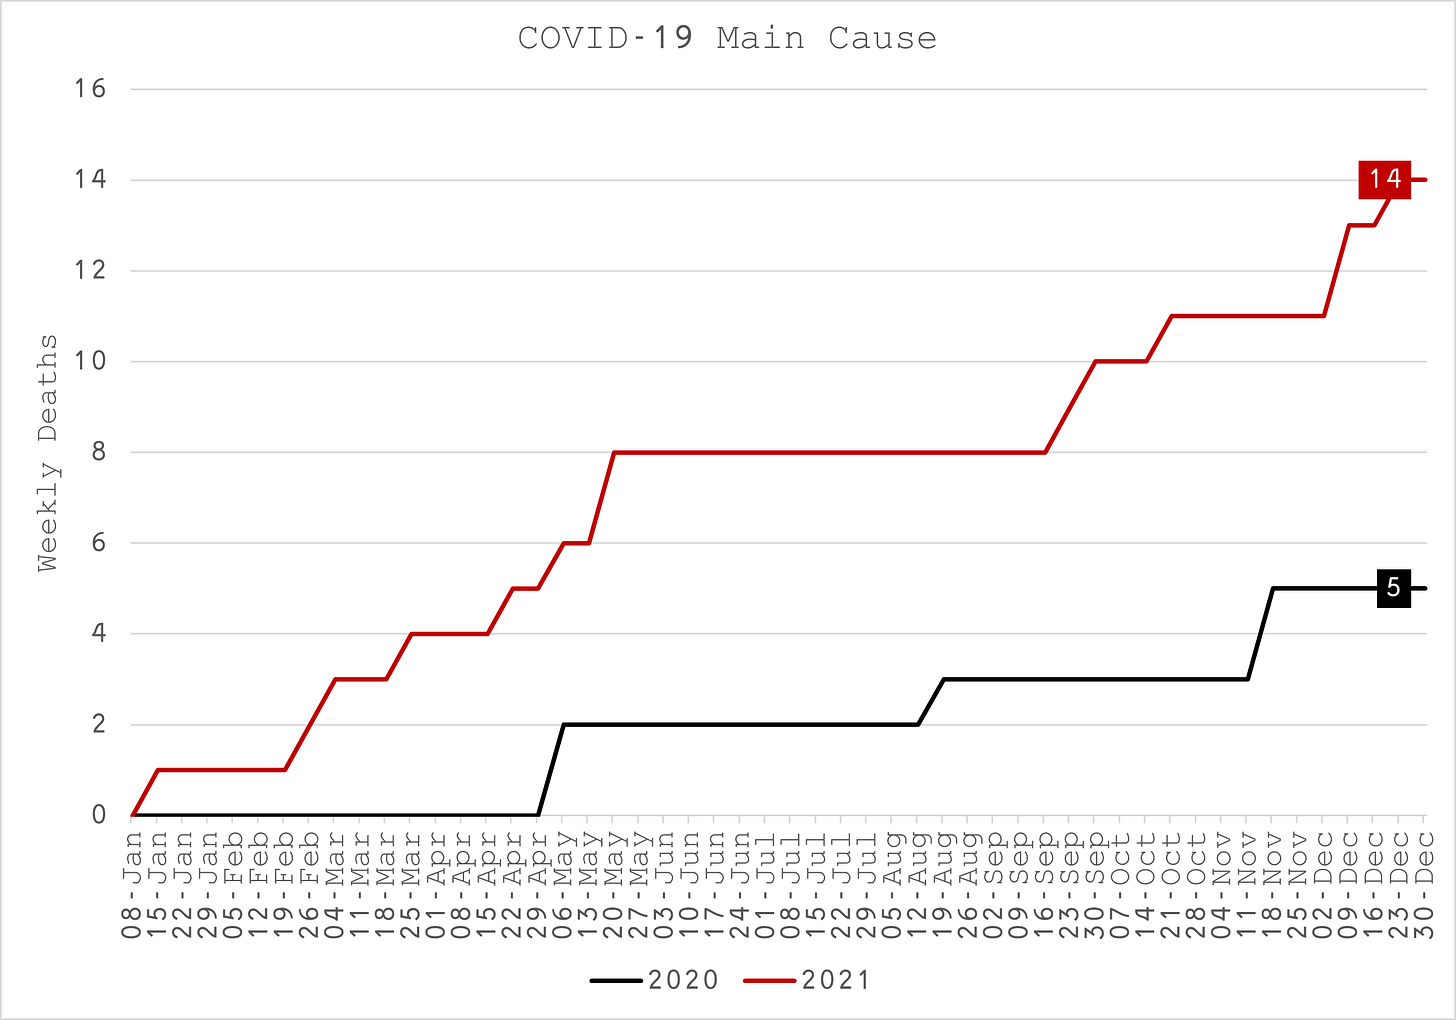
COVID-19 was the main cause of death five times in 2020 but 14 times in 2021 with most of the deaths coming after vaccinations (Figure 17).
COVID-19 was mentioned 39 times in 2020 but 69 times in 2021 (Figure 18) and is temporally associated with the excess cardiovascular (Figure 19) and respiratory (Figure 20) deaths. It is evident that the vaccination has resulted in substantially more COVID-related death in this age group.

Blacks and Hispanic excess deaths in this age group are substantially higher than the average (Figure 21) at 32% and 52% above usual for 2020 and 2021 compared to 15% and 22% respectively.
Deaths of 40 to 64 Year Olds
Deaths of 40 to 49 Year Olds and 50 to 64 Year Olds have the same patterns so I have grouped them together (Figure 22). For the first time, we can see a distinct impact of COVID-19 in spring 2020. Nevertheless, 2021 ends up with more death, 12% above usual.
Cancer is well below usual in 2020, suggesting COVID-19 displaced many of these deaths but even lower still in 2021 as those cancer deaths appear to have been displaced by other causes (Figure 23).
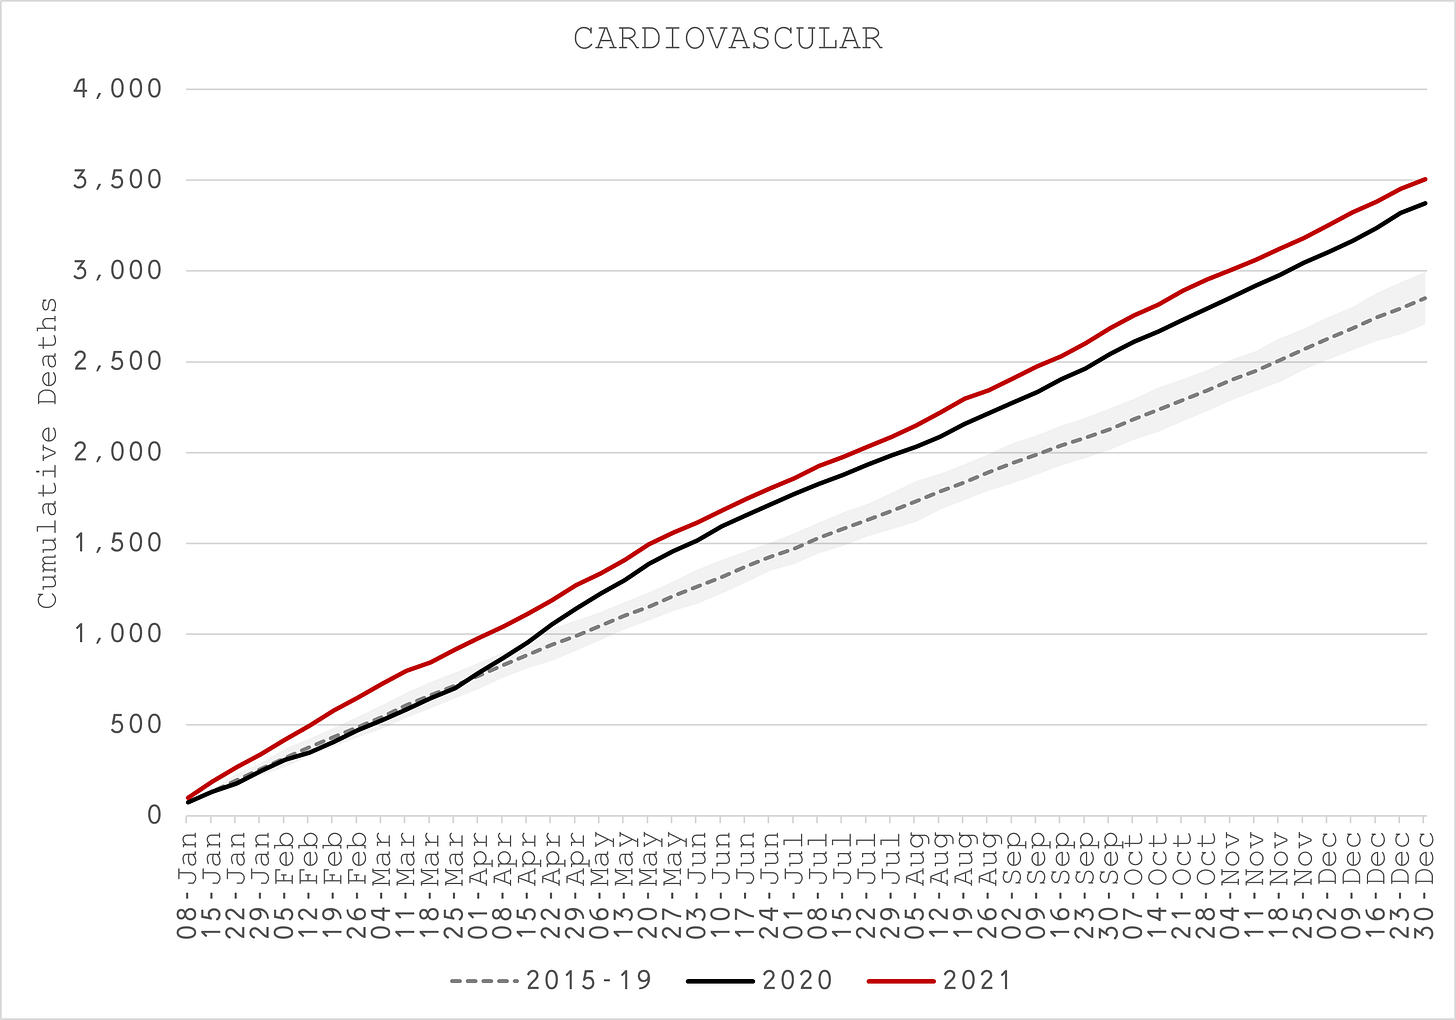
Cardiovascular (Figure 24) and respiratory (Figure 25) account for the majority of the excess in both years.
There are the same number of deaths due to COVID-19 in both years “despite” the vaccine that is claimed to reduce mortality by up to 95% (Figure 26). More unusually, the 2021 COVID-19 mortality takes off in the middle of summer, completely out of season. Still, in both years, COVID-19 only accounts for just over 1% of all deaths which is not what you would expect given how much attention it has been given.
Deaths of 65 to 74 Year Olds
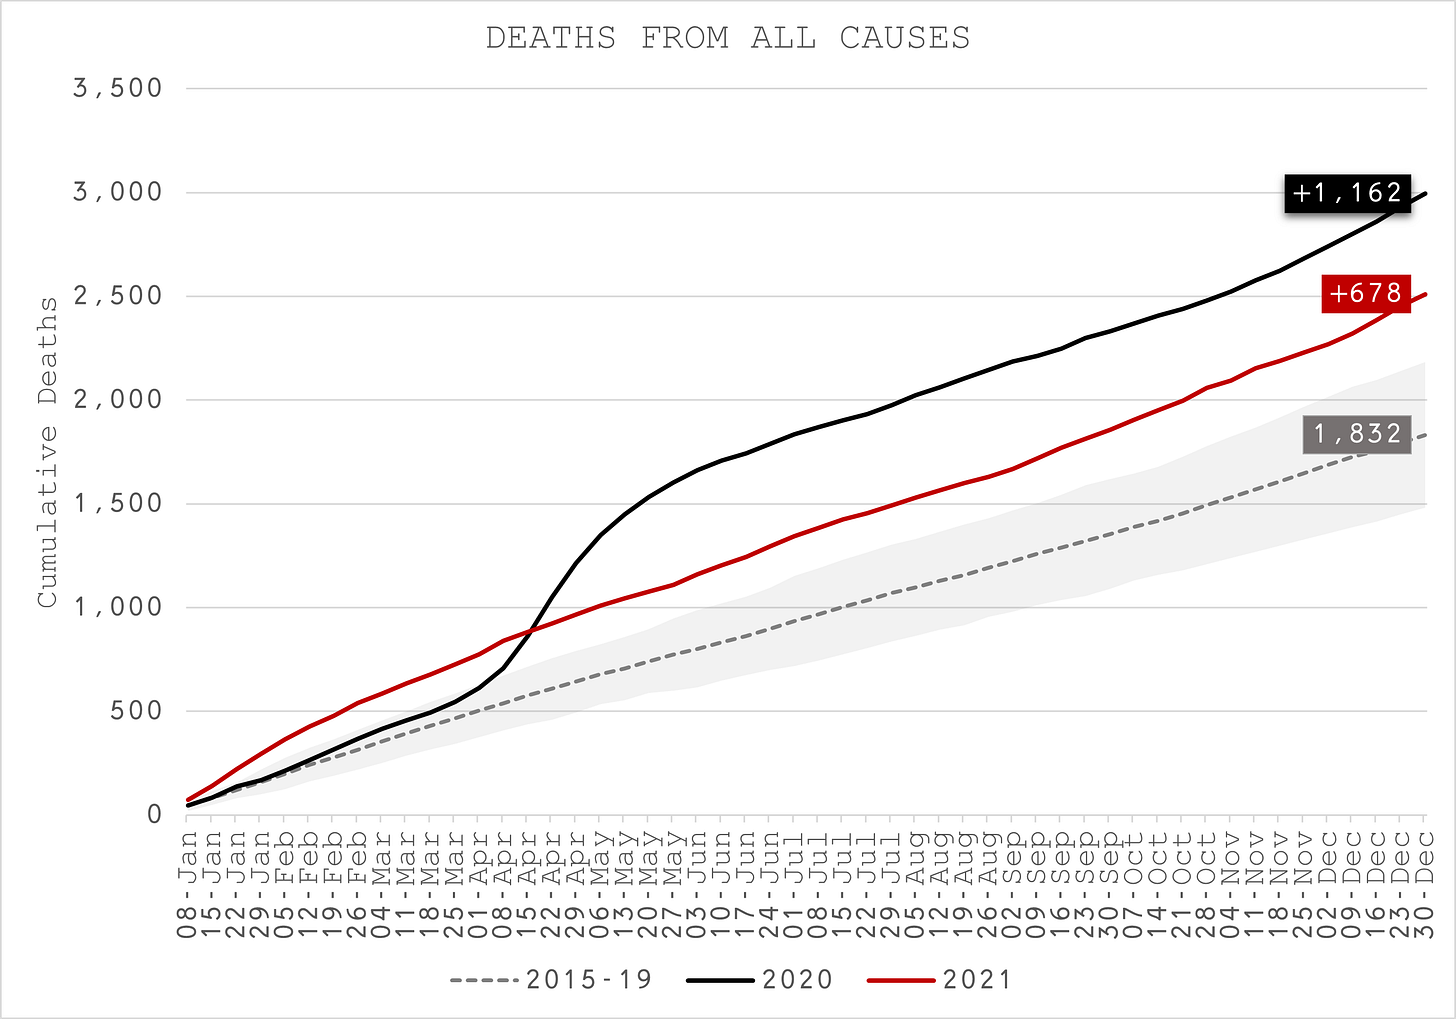
Deaths of 65 to 74 Year Olds also show the distinct impact of COVID-19 in spring 2020. Nevertheless, 2021 ends up with the same amount of death, 22% above usual (Figure 27). Again, Blacks and Hispanics are substantially higher at more than 50%.
These excesses cannot be explained by COVID-19 alone. In 2020 COVID-19 was mentioned on the death certificate 1,581 times but only 1,165 times in 2021 (Figure 28), compared to roughly 2,200 excess deaths.
Even in this older age group, COVID-19 was only the primary cause of death in less than 2% of all deaths (Figure 29).
Apart from the obvious increases in cardiovascular and respiratory diseases, the main source of non-COVID excess death in 2020 is degenerative disease (Figure 30). This is probably due to Do Not Resuscitate orders in care homes and lack of visits from family and friends. Perhaps Remdesivir also had a part to play?

Deaths of 75+ Ages
Inevitably, deaths of those aged 75 and above shows the most pronounced impact of COVID-19 given that its heterogeneity has been known from the very first reports out of Wuhan and the Diamond Princess cruise ship. In addition, this is the only age group that shows substantially more death in 2020, the year of the pandemic than 2021, the year of the vaccine (Figure 31).
Despite this, only one-third of the excess deaths in 2020 are due to COVID-19 as the main cause of death (Figure 32). After the seasonal winter outbreak, COVID-19 is largely absent as a cause of death for this age group. If there was any evidence at all of vaccine effectiveness, this is the only age group that shows it which really ought to be of paramount importance in terms of informing public health decisions. Alternatively, it might simply be the case that all the vulnerable succumbed in the spring wave.
Even the non-COVID mentioned deaths exceed expected deaths for both 2020 and 2021 driven mainly by cardiovascular (Figure 33).

Finally again, we find that Blacks and Hispanics excess deaths are substantially higher than average at over 60% for 2020 and 37% for 2021 (Figure 34), compared to just 17% and 4% for all ethnicities respectively.
Conclusion
It is apparent that as you move younger through the age groups that overall mortality and COVID-19 mortality gets relatively worse in 2021 than 2020.
This is in stark contrast to the claims that the COVID-19 vaccine is both safe and effective. On the basis of the empirical evidence presented here, outcomes are worse for all ages under 75 in the year of COVID-19 vaccinations, especially where misadventure is recorded as the cause of death.
Furthermore, it is clear from the evidence that none of the non-pharmaceutical interventions have had a discernible benefit in terms of COVID-19 mortality outcomes, neither due to the disease or as a contributing factor to the main cause of death.
It is also clear that COVID-19 is insignificant in terms of solitary cause of death and not much more significant for those who are already moribund.
There is so much more in this dataset, more than one person can cover but rest assured there are many others working on to reveal every ounce of truth about the situation.
Suggestions:
Comorbidity analysis.
Comprehensive URF analysis by discrete age ranges.
Time series analysis of COVID and non-COVID deaths compared to vaccination rates by age cohorts.
Here’s the data.
It is all being prepared for state and federal legal action so please point out any factual errors or omissions.
Thank you. ✌️
Addendum
This one is for my friend, Steve Kirsch. I asked my other friend, Jessica Rose, to see if we could use this data to estimate the under-reporting frequency (URF) in VAERs. But as I explained my thoughts to her, I ended up doing the analysis in real-time. So, this may not be thorough but as an estimate, it fits with all the other estimates Steve and Jessica have done.
If you select all vaccine deaths for 65 to 79 year olds in VAERs for Massachusetts in 2021, you get a sum total of 43 (Figure 37).
If you isolate all the deaths in this same age group where COVID-19 was not mentioned on the death certificate, you get an excess of 1,759 (Figure 38).
Assuming all these deaths were due to the vaccine would produce a URF of 41X.
I think there are around 1 million 65 to 79 year olds in Massachusetts (based on vaccination rates2). 86% were fully vaccinated by the end of 2021 and 99% had at least one dose so that makes 1,860,000 doses, yielding 945 deaths per million doses.
My friend Mathew Crawford estimates 411 so my estimate is double his (see caveats below). I also don’t know where Massachusetts considers fully vaccinated to be triple dosed. If that is the case, then inevitably my number would be lower.
Caveats
Not all the excess deaths will be due to the vaccine. The others would most likely be due to the impact of other NPIs and denial of healthcare. This would over-estimate the URF.
There may be vaccine-induced deaths that were recorded as COVID-mentioned. This would underestimate the URF.
The baseline may not be accurate since it is simply the average of the 5 years to 2019. One standard deviation is 706. So, against the 95% confidence level, the lower URF would be 8X, ceteris paribus. Incidentally, the 2020 non-COVID deaths are inside this confidence interval and they would include much of the policy deaths so I'd be confident in making the claim that 8X is the absolute lowest URF.
Addendum 2
Epoch Health recently republished an article written by Stephanie Seneff in June last year about the potential link between COVID vaccines and neurodegenerative diseases.
I thought I would see if this is supported by the deaths data.
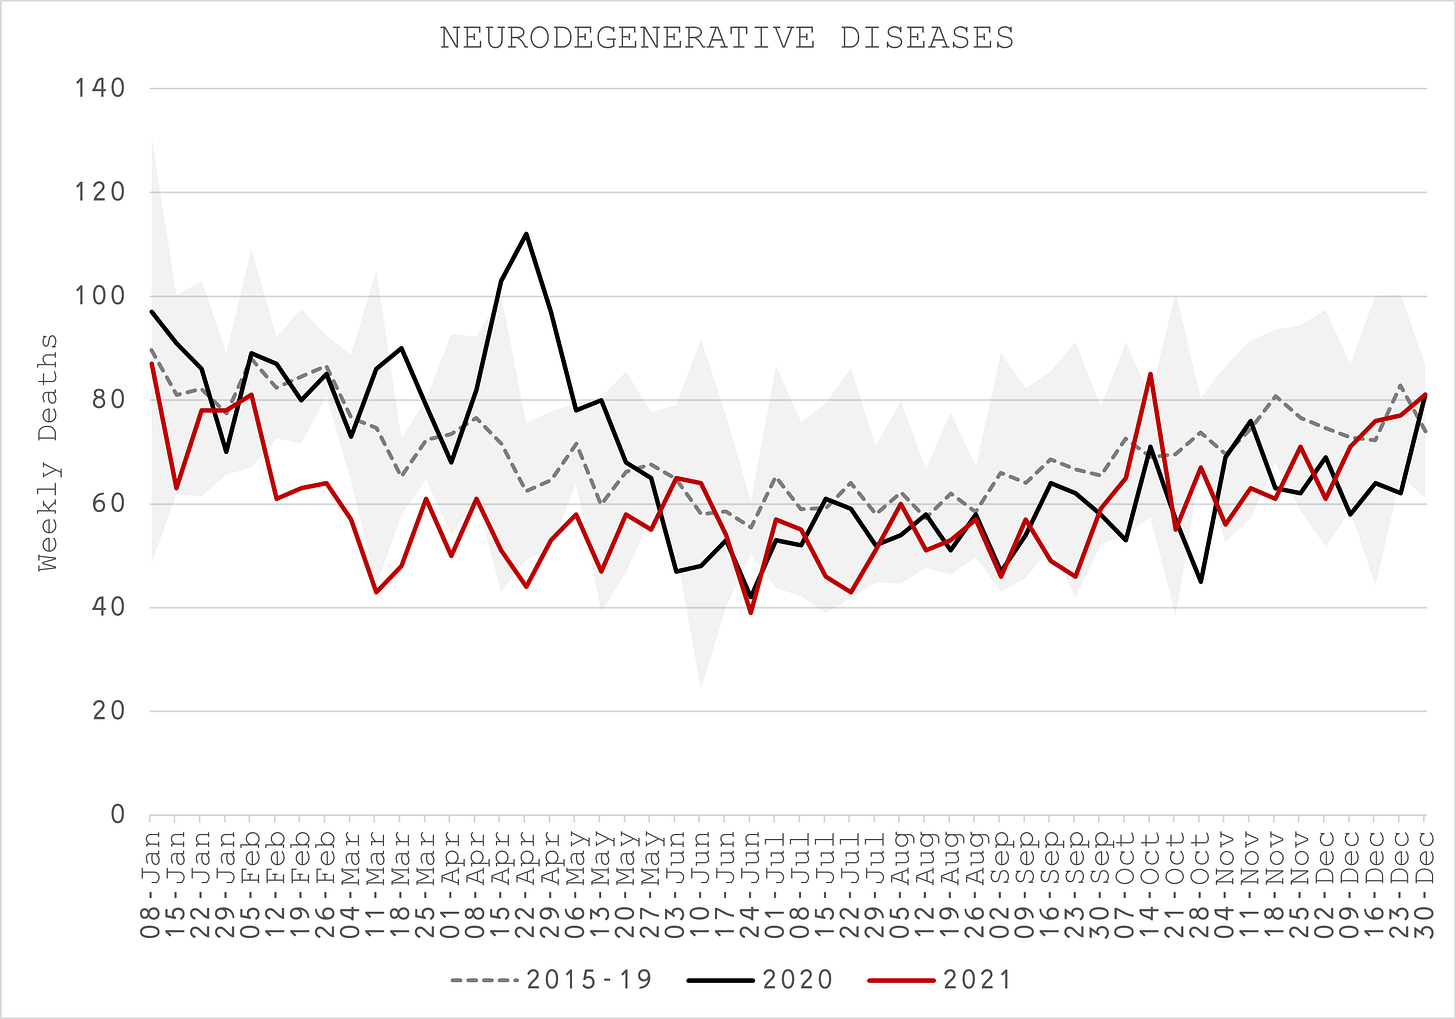
Interestingly, although there is an obvious spike in weekly deaths from around 30-Sep-2021 (Figure 39), overall deaths in this category are about 500 lower than usual (Figure 40).

Note the massive spike in April to May 2020 though. These are the iatrogenic deaths. That’s 139 more deaths than usual (+23%) over this period for this cause of death, compared to 1,798 where COVID-19 was registered as the primary cause.
Although there were evidently many more COVID-19 deaths, since we have proven many, many times that interventions most likely did not save a single life, these excess deaths were avoidable if the public health authorities had not intervened.

Conversely, there were around 500 more cardiovascular deaths than usual in 2021. It looks to me like something caused a shift from neurodegenerative to cardiovascular?

As it happens, there is the same spike in cardiovascular deaths on 30-Sep-2021 (Figure 42). There is not much conclusive information on the Massachusetts public health dashboards but “coincidentally” the FDA approved Pfizer boosters for over 65s on 22-Sep-2021 and Massachusetts boasts of being leader of the booster stakes so I’ll leave you to speculate on that. 🤔
Again, now look at the spike in non-COVID cardiovascular deaths in April to May 2020 (Figure 42) - over 1,800. That alone is more than deaths attributed to COVID-19 as primary cause.
Public health and politicians should have left COVID well alone. Business closures, lockdowns and mask mandates did not save a single COVID life but they did cause as many avoidable excess deaths from other causes as COVID itself.
And as for the vaccine? It’s already looking bad and it’s only going to get worse.
Reader Contributions
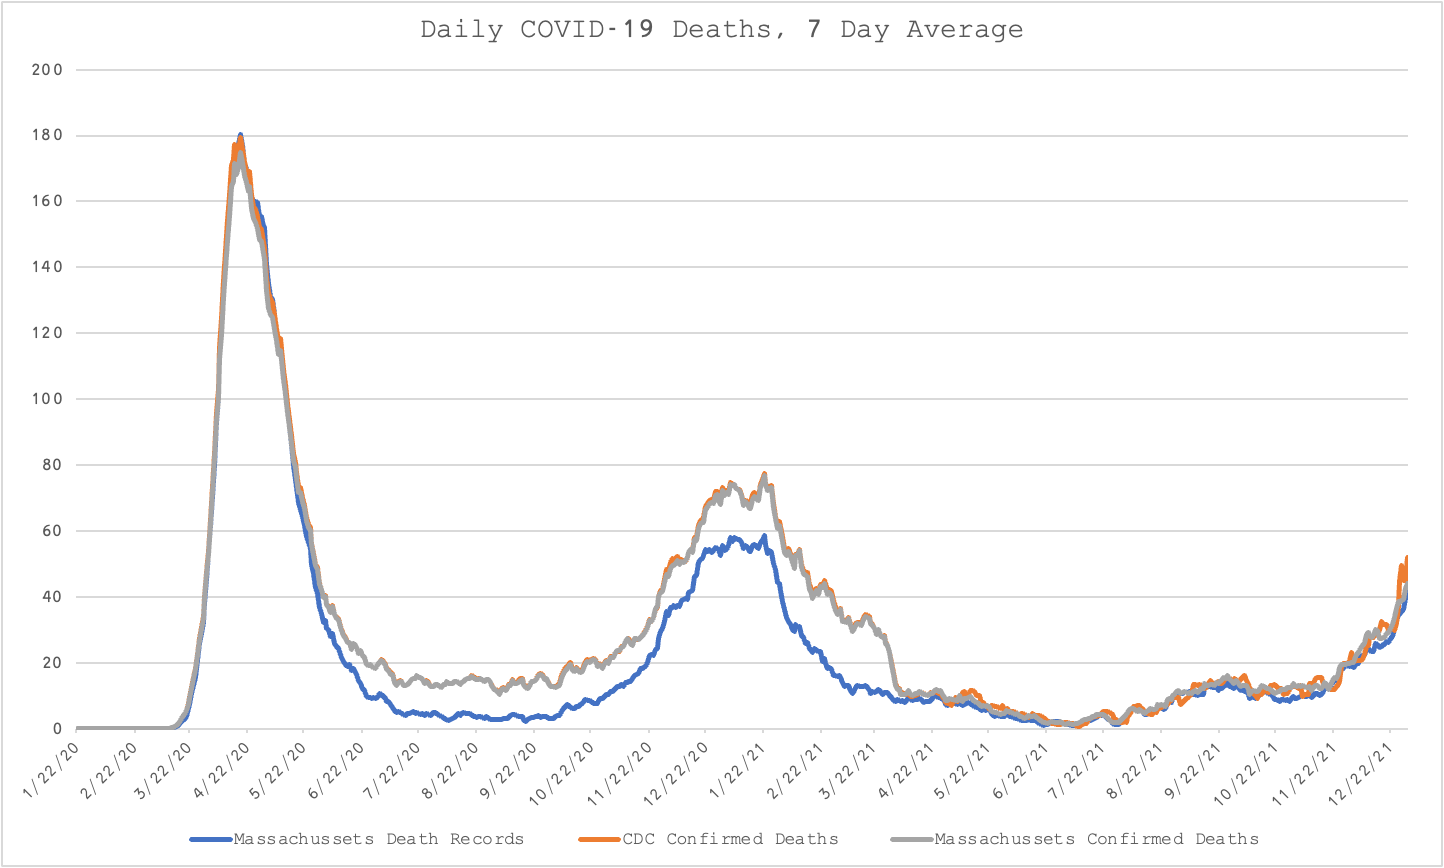
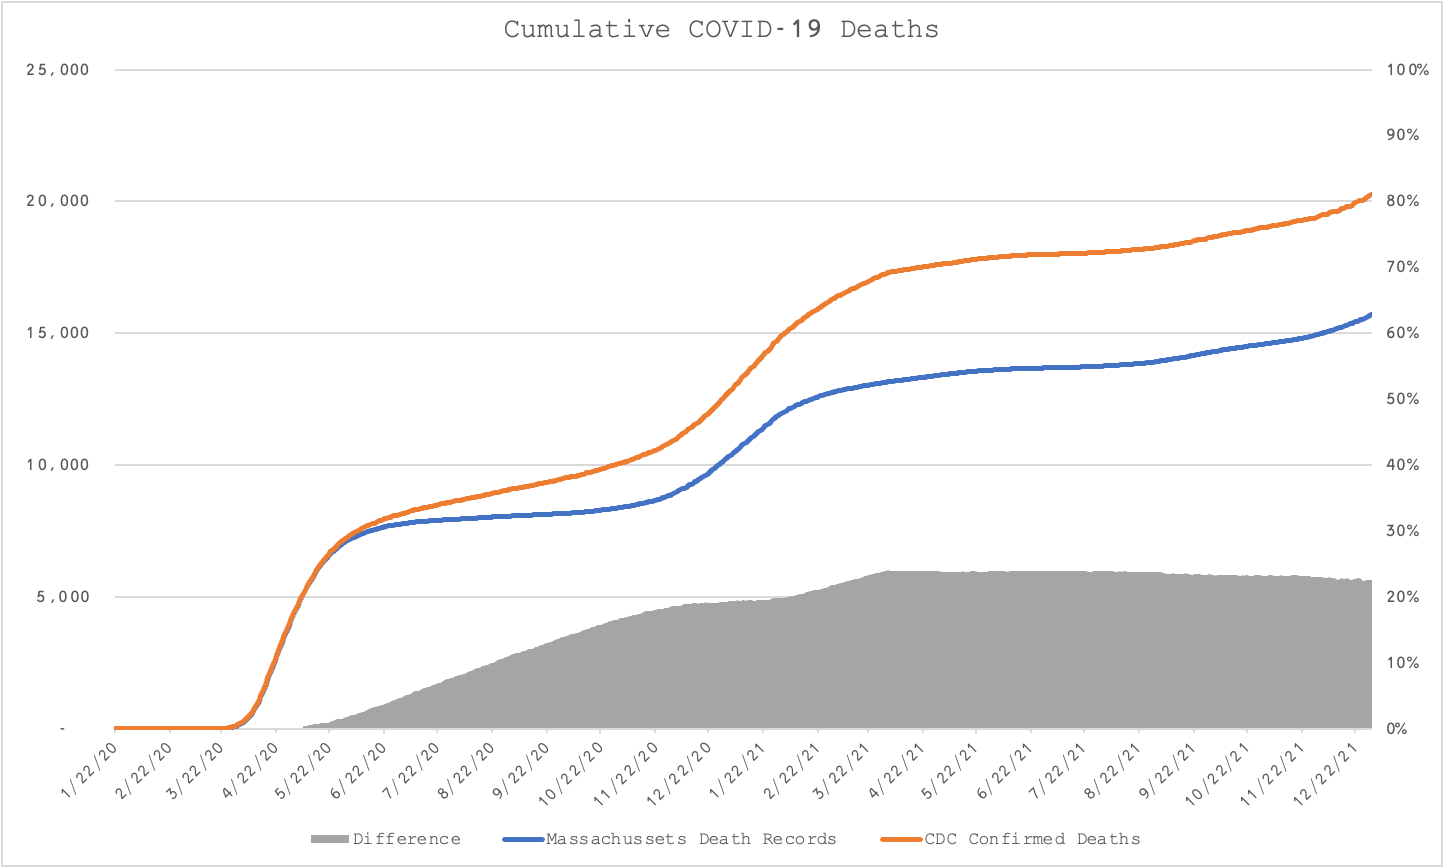
Thanks to a a reader (Matthew) for the following observation. There are quite a few more COVID deaths reported by the state (and contributed to the official CDC record) than recorded on the death certificates (Figures 35 and 36).
There are around 5,000 deaths altogether, all between end of May 2020 to April 2021.
My hypothesis is that this is the difference between deaths within 28 days of a positive test and where COVID was actually a factor of death, i.e. the death certificates are a more circumspect record. The CDC record could include false positives or situations where symptomatic COVID did not contribute to death.
Thank you, Matthew.
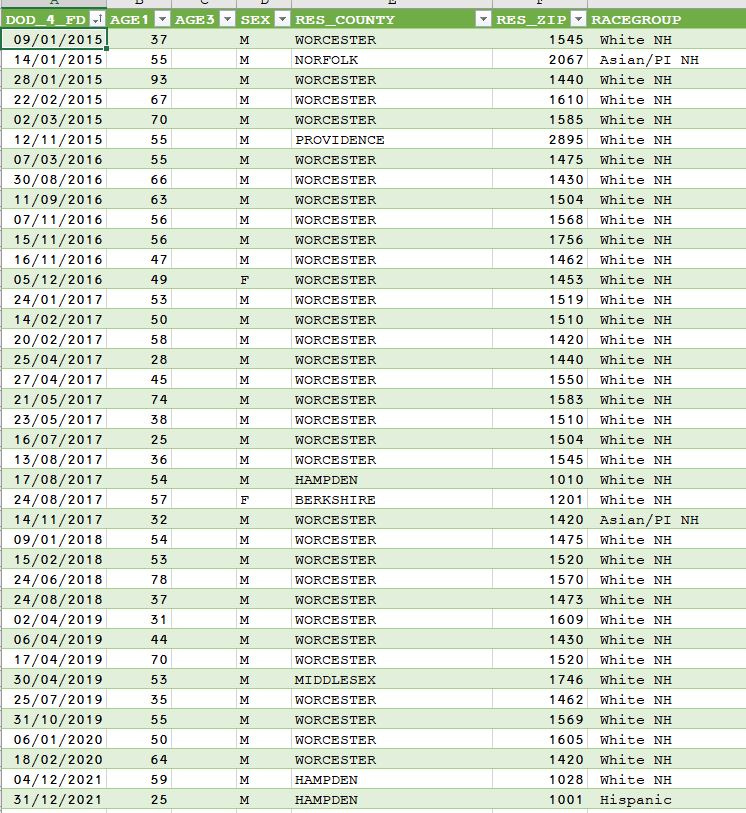
Reader asked me about self-inflicted gunshot deaths. No increase in 2020 or 2021 (in fact they are much lower) but change in pattern from males from Worcester to two men from Hampden (Figure 39). I have no local knowledge. Anybody got context on this?
A Gompertz function with only two parameters, an initial growth rate from week 0 to week 1 and a constant exponential decay of that growth rate.
https://www.mass.gov/doc/weekly-covid-19-vaccination-report-december-30-2021/download













Well done, Joel. Thanks for doing all that work.
I live in Massachusetts, and it has been infuriating to witness the extent to which innumerate, science-less imbeciles in authority here have tormented children, and ruined culture, education, businesses, and mental health, all for no reason whatsoever.
I live in a deserted, rural seacoast village, and I still see mental cases driving on country roads alone with their face diaper on.
Eric (mr_pique)
As a lifelong Masshole - and Registered Nurse - I can't tell you how much I appreciate your hard work on this Joel. It's stunning...but, sadly, I can't say that it's surprising. I have observed more crazy things in these past 2 years than I have in my entire 30 year career and to be continually told "nothing to see here, move along" - as if I'm the crazy one, has made me seriously question whether staying in the medical profession is worth my sanity. But....but...with analysis like this, I still have hope that those of us who have seen first hand what these vaccines have done to people and knew that the truth was being withheld from the public, will someday be vindicated. Thank you so very much.