


Today I’m going to be answering the question “COVID-19 – where was the Public Health Emergency?” In other words, “How serious was the threat to public health and was the government response proportionate?”
Given the media attention given to COVID and the extraordinary global response, you might think this is rather an odd question to ask at all.
But readers of my Substack will know that I will attempt to answer the question objectively. I hope to provide a phlegmatic response based on the evidence in the public mortality data which will contrast with the hyperbole spun out by the mainstream media that the majority of the unthinking populace gorge themselves upon.
With a bit of luck, I might encourage you to question for yourself if there was a public health emergency of the magnitude described by Boris Johnson on the 23rd March 2020 as the “biggest threat this country has faced for decades.”
And once you question that, perhaps you’ll start to question everything else that the govt has said and done since.
1 min 20: COVID restrictions had to be proportionate to a serious threat to public health.
For context, I searched the internet for a definition of a public health emergency.
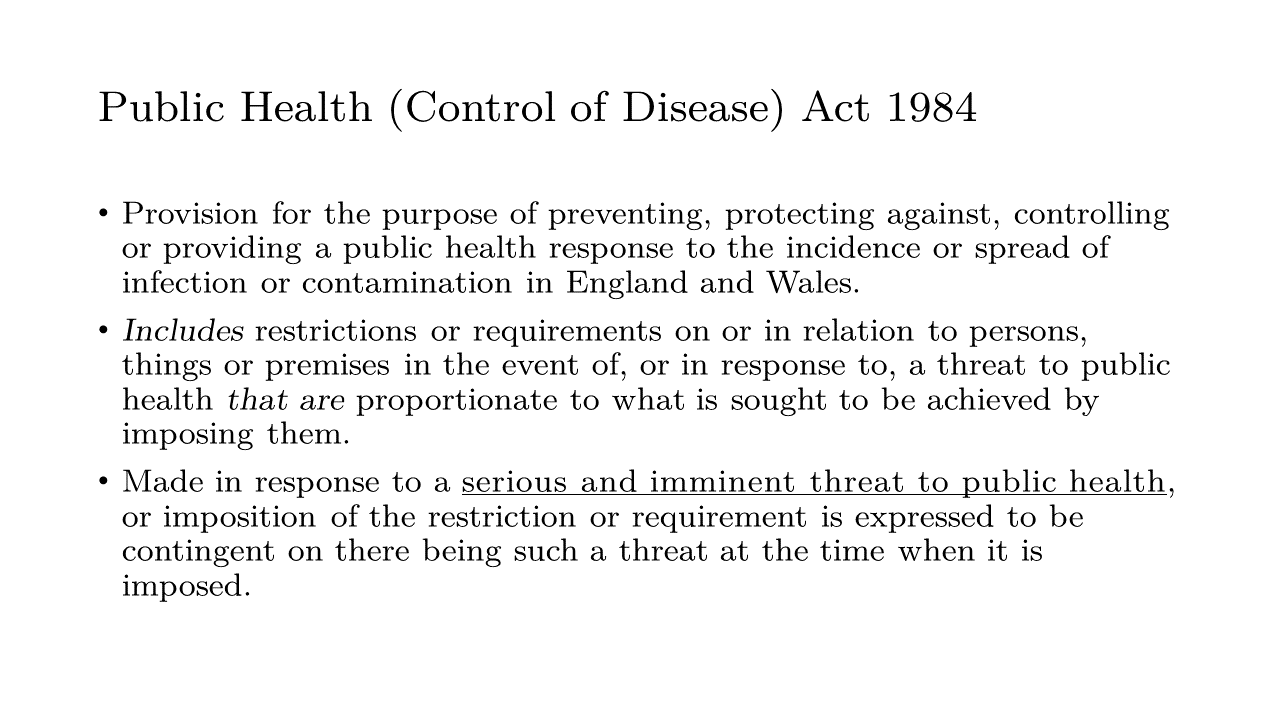
There is no definition in the UK legislation that I could find but it did lead me to the Public Health (Control of Disease) Act 1984, under which the UK’s COVID restrictions were enacted.
Here, it is clearly articulated, that restrictions should be proportionate to their objective in response to a “serious and imminent threat to public health”.
We cannot turn back time but with hindsight we can use analysis of the empirical data to test whether there was a “serious” threat to public health and therefore whether the response was proportionate.
I am using all-cause mortality as the empirical data because it is the most consistent, reliable and definitive data when it comes to public health outcomes. It does not directly identify causes of death but it is an excellent metric to measure the overall societal impact of public health events and importantly the public health response.
2 mins 48: In mortality terms, the entire event (epidemic and response) was captured between 17-Mar-20 and 31-May-20.

I’m going to keep it very simple and present the mortality data in such a way that any reasonable person can determine if there has been a serious threat to public health.
According to timeseries analysis of mortality for all ages, an event began to emerge in early/mid-Feb, causing the seasonal decline in mortality to slow down.
On 17th March 2020, mortality exploded. There is much speculation as to why deaths should suddenly spike on this day if they are due to COVID given the evidence that the virus was circulating for some time beforehand.
I cannot address this speculation except to reiterate that this data incorporates all events that might contribute to unusual or unexpected deaths, not just to the virus itself.
What is clear, is that the effect of the event(s) is completely gone by the 31st May.
Accordingly, I am going to present annual data running to 31st May between 2015 and 2021 to allow us to decide if there has been a threat to public health because this ensures that the entire first COVID wave is captured in one season, in addition to the usual “mortality” season that evidently runs between September and the following May in England.
4 mins 04: Deaths in all ages over 65 were 53k higher than average for the year, representing 0.48% of the population.

I have broken the deaths into 18 age groups between the ages of 5 and over 90.
In each case, I am presenting the annual number of deaths between June and the following May together with the average annual deaths between 2015 and 2019.
For the over 90s, deaths in 2019-20, the COVID year, are 123 thousand, 16 thousand or 15% higher than expected). For the 85-89s and 80 to 84s they are each around 10 thousand or 12% higher. For the 75-79s and 70-74s, they are around 8 thousand higher which is between 13% and 16% respectively.
The 65-69s are no higher than average.
In total, there were 53 thousand more deaths than average, representing 0.48% of the population aged 65 and over.
In each case, do you think there is evidence of a serious threat to public health?
If you believe there is, do you think the public health restrictions were proportionate to the threat?
5 mins 52: There were 6k deaths more than average for the 35 to 64s, representing 0.02% of the population.

The 60-64s and 55-59s are both around 2,000 higher or between 10% and 14% respectively.
The 50-54s are 1 thousand higher than average, about 9%
The 45-49s and 40-44s are around 100 higher, about 2%.
The 35-39s are 400 higher or 12%.
In total, there were 6,100 more deaths than average, representing 0.02% of the population aged between 35 and 64.
Do we have evidence of a serious threat to public health that affects all ages indiscriminately?
Or is there evidence that certain age groups are more affected than others?
How ought that affect public health policy in your opinion?
6 mins 54: Deaths in the under 35s were lower than usual.

For the 30-34s, there are less than 200 deaths more than average, around 7% but every year group younger than that has fewer deaths than average in spite of the declared public health emergency.
In 2019-20, is there evidence of a serious public health threat to young people in England?
7 mins 20: Restrictions had no impact whatsoever on the number or distribution of deaths.

There is, of course, one major flaw with this retrospective judgement. What if the policies enacted were successful in mitigating the serious public health threat? If so, then our hindsight analysis would be faulty.
Fortunately, we can empirically test the impact of restrictions on deaths using the application of the Gompertz function.
This mathematical function assumes a constant decay in growth from one time period to another. There can only be one solution for any distribution, calibrated to any part of it. If all parts of the empirical distribution, such as we observe, lie on the model, it is proof that no exogenous factor had an impact on it, neither positive or negative.
If restrictions had mitigated the public health threat then the empirical data would have fallen below the model but it never does. Evidently, there was no benefit in terms of reduced mortality as a result of the restrictions.
8 mins 26: The restrictions were “The most significant set of restrictions on British life in living memory” according to The Guardian newspaper.

So, what did you conclude?
Stay Home, protect the NHS, save lives?
As a reminder, the restrictions, “The most significant set of restrictions on British life in living memory”, according to The Guardian at the time:
Boris Johnson decreed that ALL people can only shop for basic necessities, limited exercise to one form a day, restricted travel only to and from essential work and told the UK to stay at home.
I believe I am a reasonable person and having looked objectively at the 18 sets of data, I would be very confident to conclude that there was no serious threat to public health between March and May 2020.
I would admit that there was an elevated risk of mortality for over 50s but would not agree that the restrictions imposed by this government were anywhere near proportionate to that risk.
And with hindsight, the restrictions were completely ineffective anyway!
9 mins 18: The real extent of the risk was known in February 2020 but was exaggerated.

But hindsight is a wonderful thing. Even with imperfect data reporting, could better judgement have been informed sooner?
Well data from the Diamond Princess cruise ship in February 2020 gave us exactly the same insights that I have shared in today’s analysis.
But as a sign of the times, those of us that dared to refer to it to make the point (repeatedly) that the government response was completely disproportionate to the risk were gaslighted and shut down.
Fortunately, we have archived all the evidence so that hopefully lessons will be learned. Whether or not they are really depends on people’s understanding of these basic facts.
There is evidence throughout of egregious misinformation peddled by the government about the true magnitude of the threat of COVID which I hope I have outlined clearly here.
The next step is to take the government to task of presenting a counter-argument. Where was the public health emergency? How on earth does it still persist today?
Apologies for the background noises of my dog eating a box and my cat having his dinner!


Share this post